

Abstract
Background Cerebral ischemia-reperfusion injury (CIRI) leads to cognitive dysfunction, neuronal death, and inflammation. Understanding the molecular mechanisms underlying CIRI is crucial for developing effective therapeutic strategies.
Objective This study aims to investigate the roles of activating transcription factor 3 (Atf3) and lon protease homolog 1 (Lonp1) in CIRI, particularly focusing on how Atf3 regulates Lonp1 expression and its effects on mitochondrial function.
Methods Single-cell transcriptomics and proteomic analyses were employed to explore Atf3's influence on Lonp1 and its subsequent impact on neuronal survival and apoptosis.
Results The findings indicate that Atf3 plays a crucial role in modulating Lonp1 expression, which in turn affects mitochondrial function, neuronal survival, and apoptotic pathways.
Conclusion This study provides new insights into the regulatory mechanisms of Atf3 and Lonp1 in CIRI, identifying potential therapeutic targets for managing ischemic brain injury and neurodegenerative diseases.
WHAT IS ALREADY KNOWN ON THIS TOPIC
Cerebral ischaemia-reperfusion injury (CIRI) is associated with neuronal death, inflammation and mitochondrial dysfunction, partially regulated by the transcription factor activating transcription factor 3 (Atf3) and the mitochondrial protease lon protease homolog 1 (Lonp1). Previous studies have identified individual roles of Atf3 and Lonp1 in cellular stress responses, but their specific interactions and combined effects on CIRI remain unclear.
WHAT THIS STUDY ADDS
This study demonstrates that Atf3 regulates Lonp1 expression, contributing to neuronal survival and mitochondrial function under ischaemic conditions. The findings reveal an Atf3→Lonp1 pathway that influences neuronal apoptosis and oxidative stress, thus advancing our understanding of the molecular mechanisms in CIRI.
HOW THIS STUDY MIGHT AFFECT RESEARCH, PRACTICE OR POLICY
These insights into the Atf3-Lonp1 pathway offer potential therapeutic targets for mitigating neurodegenerative effects in ischaemic injury. Targeting this pathway could inform future interventions in clinical settings to improve outcomes for patients with CIRI.
Introduction
Cerebral ischaemia-reperfusion injury (CIRI) is a neurodegenerative condition triggered by restoring blood flow after an interruption, leading to brain dysfunction, neuronal death and inflammation.1 2 While some treatments are available, a deeper understanding of the molecular mechanisms underlying CIRI is essential to develop more effective therapies.3 4 Activating transcription factor 3 (Atf3) and lon protease homolog 1 (Lonp1) are critical regulators of inflammation, apoptosis and mitochondrial function, yet their roles in CIRI remain insufficiently explored.5 6
This study investigates the regulatory interaction between Atf3 and Lonp1 in CIRI using single-cell transcriptomics, proteomics and in vitro and in vivo models. Single-cell analysis identifies microglia as pivotal contributors to CIRI pathology.7 Moreover, Atf3 knockdown exacerbates neurobehavioural impairments and oxidative damage, underscoring its significance in disease progression.8 Proteomic analysis reveals that Atf3 modulates mitochondrial function by regulating Lonp1 expression, with downstream effects on neuronal survival and apoptosis. Elucidating this Atf3-Lonp1 pathway offers promising insights into potential therapeutic strategies for CIRI.
Materials and methods
Construction of mouse middle cerebral artery occlusion/reperfusion injury model
Male C57BL/6J mice (22–25 g, 8 weeks old) from Beijing Vital River and Cx3cr1-Cre mice from the Jackson Laboratory were maintained under controlled conditions. All procedures adhered to ethical guidelines, and measures were taken to minimise pain. Mice were divided into sham (exposure of neck arteries without occlusion) and mouse middle cerebral artery occlusion/reperfusion (MCAO/R) groups, observed at 1, 3, 7 and 14 days post injury. Subgroups included shNC (AAV sh-NC) and Atf3 interference (AAV sh-Atf3) with five mice per group. Mice were anaesthetised using 2% isoflurane, and a midline neck incision was made to expose the internal carotid arteries. To induce ischaemia, the right internal carotid artery was occluded for 2 hours, followed by reperfusion. Blood flow was carefully monitored, and mice with less than a 75% reduction in flow were excluded from the study.
AV viral vector transduction in mice
To achieve glial-specific Atf3 knockout in mice, an AAV2/6 vector encoding U6-DIO-shNC-EGFP and U6-DIO-Atf3 shRNA-EGFP (titre: 2–3×10¹² viral particles/mL) was injected. The effective Atf3 interfering sequence is listed in online supplemental table S1. Stereotaxic surgery was used to inject 500 nL of virus solution into the hippocampal CA1, cortical and striatal areas at a rate of 50 nL/min, following precise coordinates: hippocampal CA1 (AP: −2.00 mm; ML: −1.55 mm; DV: −1.55 mm), cortical (AP: 0.00 mm; ML: −2.05 mm; DV: −1.50 mm) and striatal (AP: 0.00 mm; ML: −2.05 mm; DV: −3.50 mm).9
Supplementary data
scRNA-seq data generation
A sham group of mice was used, and right hemisphere brain tissue samples were collected at 1, 7 and 14 days post-MCAO/R for single-cell RNA sequencing. Unique molecular identifiers and barcodes were used for reverse transcription and cDNA synthesis. Sequencing libraries were quantified with a high-sensitivity DNA chip on a Bioanalyzer 2100, and sequencing was performed on a NovaSeq 6000 (Illumina) with the 2×150 chemistry method.
scRNA-seq data processing, quality control and integration
The 10x Genomics Cell Ranger toolkit (V.3.0.1) was used to generate FASTQ files, extract barcodes and UMIs, and filter and map reads to the GRCh38 reference genome, resulting in a matrix with normalised gene counts and cell identities for each sample. Quality control criteria included 200<nFeature_RNA<8000, 1000<nCount_RNA<10 000, and percent.mt<10%.10 Data were analysed using the ‘Seurat’ package in R.11
t-SNE clustering analysis and cell annotation
Principal component analysis was conducted on the top 2000 highly variable genes, selecting 17 components for downstream analysis using Seurat. The t-SNE algorithm was applied for non-linear dimensionality reduction. Marker genes were filtered and annotated using the ‘single’ package and relevant literature. Cell-cell communication analysis was conducted using the ‘cellchat’ package.
Transcriptome sequencing of mouse hippocampal tissues
The right hemisphere brain tissues from sham (n=5) and MCAO/R (n=5) mice were ground in liquid nitrogen, and total RNA was extracted. After rRNA removal and RNA fragmentation, first- and second-strand cDNA were synthesised. Libraries were constructed, enriched via PCR and assessed for quality using an Agilent 2100 Bioanalyzer. Sequencing was performed on an Illumina HiSeq platform, and raw reads were processed to remove adapters and low-quality sequences. Clean reads were aligned to the mouse genome using HiSAT2, and differential mRNA analysis was conducted using the ‘Deseq’ package with |logFC|>1 and False discovery rate (FDR)<0.05.12
Neurological function scoring
The modified Longa scoring method13 was used to assess neurological impairment in mice. The scoring system was as follows: 0 for normal movement, 1 for partial failure to extend the left paw, 2 for leftward walking rotation, 3 for an unstable gait and 4 for impaired consciousness or inability to walk. Mice exhibiting death, respiratory distress, unstable vitals or intracranial bleeding were excluded based on initial scores.9
2,3,5-Triphenyl tetrazolium chloride staining
Following MCAO/R surgery, mice were euthanised, and 2-mm-thick brain slices were prepared and stained with 1% 2,3,5-triphenyl tetrazolium chloride (TTC) to visualise ischaemic infarction. Slices were incubated at 37°C, then fixed in 4% Paraformaldehyde (PFA) and analysed using ImageJ software.9
Behavioural tests
Morris water maze test
Mice were trained for 6 days, with four trials per day, to locate a hidden platform in a 120 cm maze within 60 s. Mice that failed to find the platform within the time limit were guided to it. A probe test was performed 24 hours later, recording time in the target quadrant and platform crossings.
Novel object recognition test
Mice were given 5 min to explore two identical objects. After a 1 hour break, one object was replaced. Exploration time and discrimination ratio were recorded. Areas were cleaned with 75% ethanol between trials.
Neuromuscular coordination test
Mice were pre-adapted on the Rota-Rod at 10 rpm for 5 min. On the test day, the rod accelerated from 4 to 40 rpm over 5 min, and the average time before falling was recorded.
Determination of biochemical markers
Brain tissue was homogenised in ice-cold saline (1:9 ratio) and centrifuged at 10 000 g for 15 min at 4°C. The supernatant was used to assess oxidative stress using ROS, 4-HNE, 8-OHDG, NT-3, PARP1, and 3-NT kits.
Quantitative proteomic analysis of Atf3-interfered MCAO/R injury
Animal selection and assessment
Animals were randomised by age and weight, and assessed by a single researcher. Groups included sham, MCAO/R, shNC_MCAO/R and shAtf3_MCAO/R (three animals each).
Protein extraction and analysis
Brain proteins were extracted and lysed ultrasonically, and protein concentration was measured using a BCA kit. Samples were digested, cleaned and analysed by MS/MS using MaxQuant.
iTRAQ labelling and analysis
Desalted peptides were analysed with QSTAR Elite Hybrid MS and HPLC. LC-MS/MS was performed in triplicate, and DIA data were processed with Spectronaut V 13. Differentially expressed proteins were filtered (p<0.05, logFC>1.0).
Cell culturing, transfection and OGD/R protocol
Primary neurons were prepared from neonatal C57BL/6J mice (1–2 days old). Cells were isolated, centrifuged, resuspended in neuronal basal media and plated on poly-lysine-coated plates. Cultures were maintained at 37°C with 5% CO₂. Microglia were cultured in Dulbecco's Modified Eagle Medium (DMEM) supplemented with 10% fetal bovine serum (FBS), 10 µg/mL streptomycin and 100 U/mL penicillin. Cells were kept at 37°C in a 5% CO₂ incubator and passaged when they reached 80–90% confluence.14–16 Brain cortices were dissected, filtered and incubated in high-glucose DMEM with 10% FBS and 1% antibiotics. Microglia were isolated and enriched using Percoll centrifugation. To model ischaemic stroke, cells were subjected to 60 min of oxygen-glucose deprivation, followed by 24 hours of reperfusion in high-glucose DMEM.
Co-culture of neurons and microglia
Neurons and microglia were co-cultured using a transwell system equipped with a 0.4 µm membrane to allow cytokine diffusion. Neurons were cultured in the lower chamber, while microglia were placed in the upper chamber. After lentiviral transfection of microglia, the transwell insert was moved to the neurons, and the co-culture was maintained for 24 hours before undergoing OGD/R treatment.17
Lentiviral transfection
Lentiviral infection was performed on glial cells (sh-Atf3) and neurons (oe-Lonp1). Groups included Control/sh-NC, Model, Atf3 knockdown and Atf3 knockdown+Lonp1 overexpression. Lentiviruses were co-transfected into 293T cells, packaged and used for transduction at multiplicity of infection (MOI)=10 with polybrene. Transfection efficiency was confirmed by luciferase and western blot, and stable cell lines were selected for subsequent experiments. The transfection sequences are shown in online supplemental table S1.
Immunofluorescence
Cells were plated, fixed in 4% PFA, permeabilised and blocked. Placental tissues were fixed, sectioned and blocked with 2% bovine serum albumin (BSA). Samples were incubated overnight with primary antibodies (the antibody information is provided in online supplemental table S2, followed by PBS washing, secondary antibody incubation and 4',6-diamidino-2-phenylindole (DAPI) staining. Fluorescence was observed under a Zeiss Axiovert 123M microscope, and fluorescence coverage was averaged across six fields.18
TUNEL analysis
DNA fragmentation was detected using a one-step TUNEL apoptosis detection kit with red fluorescence from Biyuntian. After DAPI co-localisation, TUNEL-positive cells were manually counted in at least six fields per sample.19
CCK-8 assay
Cell proliferation was measured with the CCK-8 assay kit. Neurons were seeded in a 96-well plate, with 10 µL of CCK-8 solution added to each well. After 2 hours of incubation, absorbance was measured at 450 nm using a microplate reader. Three parallel wells were used per group.20
Measurement of mitochondrial membrane potential
Neurons were incubated with 100 nM tetramethylrhodamine ethyl ester (TMRE) for 20 min at 37°C, then washed with PBS+0.2% BSA. Fluorescence was measured at Ex/Em 549/575 nm using a SpectraMax microplate reader. For positive control, 3 µM carbonyl cyanide p-trifluoromethoxyphenylhydrazone (FCCP) and 100 nM TMRE were added to a separate well. Results were expressed as relative TMRE fluorescence.
Neurons were plated in collagen-coated glass dishes and treated with 10 nM TMRE for 10 min. Real-time imaging was conducted using a Zeiss Axiovert 123M fluorescence microscope.
Mitochondrial membrane potential was measured using JC-1 dye. Neurons were incubated with 1× JC-1 dye or 1× JC-1+10 µM FCCP for 20 min. Cells were analysed by flow cytometry, measuring red (PE-A) and green (FITC) fluorescence. Data were processed using FlowJo software.19
Measurement of mitochondrial superoxide levels
Cells were incubated at 37°C with 5 µM MitoSOX Red for 10 min and stained with MitoTracker Green. Fluorescence (red: Ex/Em 550/575 nm; green: Ex/Em 480/500 nm) was captured, and the MitoSOX/MitoTracker ratio was calculated. Neurons were incubated with MitoSOX and analysed using flow cytometry and FlowJo software.
Transmission electron microscopy analysis
Neuronal samples were fixed in 2.5% glutaraldehyde and 1% osmium tetroxide at 4°C. After ethanol dehydration, samples were embedded in epoxy resin at 60°C for 24 hours. Thin sections were stained and observed using a Hitachi H-7500 electron microscope to quantify mitochondrial abnormalities.19
RT-qPCR
Total RNA was extracted using Trizol reagent (catalogue number 15596026, Invitrogen, USA). The RNA was reverse transcribed into cDNA following the instructions of the PrimeScript RT Reagent Kit (catalogue number RR047A, Takara, Japan). The synthesised cDNA was then subjected to RT-qPCR analysis using the Fast SYBR Green PCR Kit (catalogue number 11736059, Thermo Fisher Scientific Co, Ltd, Shanghai, China), with three replicates per well. β-Actin was used as the internal reference. The relative expression levels were calculated using the 2-ΔΔCt method (the primer sequences are provided in online supplemental table S3, synthesised by Takara).21 22
Western blot
Cell protein samples were quantified using the Pierce BCA Protein Assay Kit. Proteins were extracted with RIPA buffer, and 20 µg of each sample was run on SDS-PAGE and transferred to a nitrocellulose membrane. After blocking, the membrane was incubated with primary and secondary antibodies. Immunoreactive bands were visualised using enhanced chemiluminescence and analysed with ImageJ, with β-actin as the loading control (antibody information is provided in online supplemental table S2. The experiment was repeated three times.
CHIP
When 293T cells reached 70–80% confluence, 1% formaldehyde was added to fix the cells, crosslinking DNA and proteins. After sonication (15 cycles), the supernatant was collected and divided. Rabbit IgG and anti-Atf3 antibodies were added for overnight incubation. Endogenous DNA-protein complexes were precipitated, washed and eluted by reverse crosslinking. DNA fragments were purified and analysed using ChIP-qPCR, with the primer sequences provided in online supplemental table S3.
Dual-luciferase reporter assay experiment
293T cells were cultured for 24 hours in a 48-well plate. Wild-type (WT) or mutant (Mut) plasmids containing Atf3 and Lonp1 promoter binding sites were co-transfected with shAtf3 or NC plasmids. After 48 hours, luciferase activity was measured using the Pierce Firefly Luciferase Dual Assay Kit. Relative luciferase activity, calculated as the ratio of Firefly luciferase to Renilla luciferase, was determined. The experiment was repeated three times.
Statistical analysis
Data were obtained from at least three independent experiments and presented as mean±SD Two-sample independent t-tests were used for two-group comparisons, and analysis of variance with Tukey’s honestly significant difference post hoc test for three or more groups. Non-normal data were analysed with the Mann-Whitney U or Kruskal-Wallis H test. Analyses were done using GraphPad Prism 9 and R, with p<0.05 considered significant.
Results
Cellular heterogeneity and cell-type analysis in CIRI
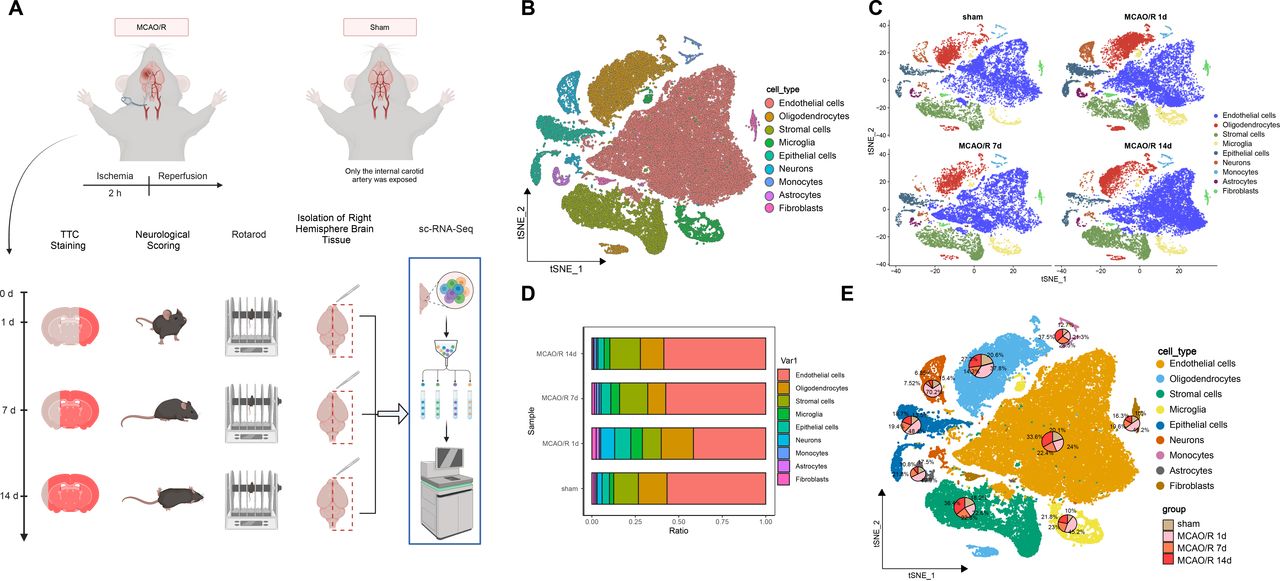
Mice in the MCAO/R group exhibited larger infarct volumes (online supplemental figure S1A), shorter rotation duration (online supplemental figure S1B) and impaired neurofunction (online supplemental figure S1C) compared with the sham group. One mouse per group was selected for right hemisphere brain tissue isolation and single-cell analysis using 10x Genomics technology (figure 1A).

Single-cell landscape analysis based on single-cell sequencing in mouse middle cerebral artery occlusion/reperfusion (MCAO/R) samples. (A) Behavioural tests were conducted on days 1, 7 and 14 after MCAO/R, and mRNA transcripts from individual cells extracted from the brain were analysed. Single cells were extracted from the brain for analysis using the 10x Genomics technique. (B) t-SNE clustering analysis was performed on the annotated cell types after batch effect removal. (C) The distribution of different cell types in the sham group and samples on days 1, 7 and 14 after MCAO/R was compared. (D) Bar graphs illustrate the proportions of overall cell composition in the sham group and samples on days 1, 7 and 14 after MCAO/R, with cell types colour-coded. (E) t-SNE clustering plots demonstrate the proportions of individual cell types in the sham group and brain tissue samples on days 1, 7 and 14 after MCAO/R.
Using the 10x Genomics scRNA-seq platform, 58 857 high-quality cells were identified, and after quality control, 31 053 highly variable genes were retained. Downstream analysis focused on the top 2000 variable genes (online supplemental figure S2A). The top four principal components were visualised (online supplemental figure S2B) and analysed using Seurat’s RunPCA function (online supplemental figure S2C). The top 17 principal components were selected via the ElbowPlot function for further analysis (online supplemental figure S2D).
Cells were classified into 10 subgroups (online supplemental figure S2E–F) and annotated based on known cell markers. Nine cell types were identified: endothelial cells, oligodendrocytes, stromal cells, microglia, epithelial cells, neurons, monocytes, astrocytes and fibroblasts (figure 1B,C). The top 5 genes for each cell type are shown in a heatmap (online supplemental figure S2G).
The t-SNE plot showed temporal variations in neurons, epithelial cells, microglia, astrocytes and fibroblasts between the MCAO/R and sham groups (figure 1D). On days 1, 7 and 14 post-MCAO/R, the percentage of microglia was 45.2%, 23.0% and 21.8%, compared with 10.0% in the sham group (figure 1E).
The crucial role of microglia in CIRI
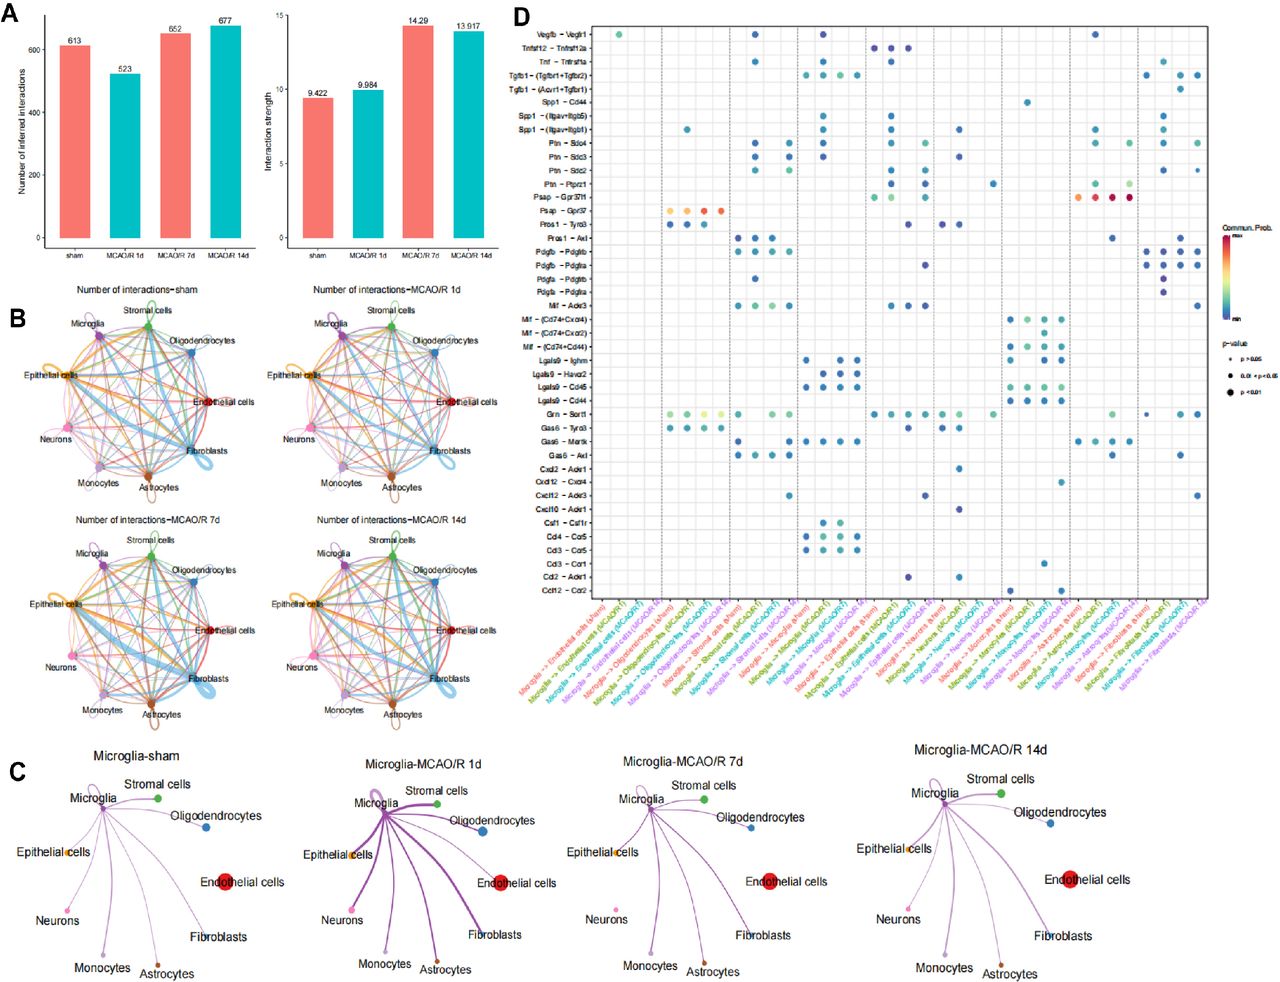
To explore the mechanisms driving CIRI’s cellular evolution, we analysed cell-cell communication through ligand-receptor interactions using the ‘CellChat’ R package. We calculated the communication probability of all ligand-receptor pairs across signalling pathways, revealing variations in communication strength among the nine cell subpopulations in the sham and MCAO/R groups at 1, 7 and 14 days (figure 2A).

Identification of cell-cell interactions in the cellular microenvironment of ischaemia-reperfusion brain tissue. (A) Statistical bar graphs showing the number of cell-cell communications and interaction strength between nine cell subtypes in the sham group and at 1, 7 and 14 days after mouse middle cerebral artery occlusion/reperfusion (MCAO/R). (B) Circos plots depicting the number of cell communications in the sham group and at 1, 7 and 14 days after MCAO/R, with line thickness representing the number of pathways. (C) Circos plots illustrate the number of cell communications between microglia and other cells in the sham group and at 1, 7 and 14 days after MCAO/R, with line thickness representing the number of pathways. (D) Heatmaps displaying significant correlations (L-R pairs) with microglia in the sham group and at 1, 7 and 14 days after MCAO/R.
At 1 day post-MCAO/R, microglia showed increased communication, while stromal cells, fibroblasts and epithelial cells exhibited reduced interactions (figure 2B,C). Microglia-cell communication with astrocytes and neurons increased post-MCAO/R, and ligand-receptor pairs rose, indicating microglia’s influence on neural function (figure 2D).
Role of Atf3 in CIRI and its upregulation in microglia
To explore CIRI’s regulatory mechanisms, transcriptome sequencing (bulk RNA-seq) identified 612 differentially expressed genes (568 upregulated, 44 downregulated) (online supplemental figure S3A, table S4). Single-cell RNA-seq of microglia revealed 900 differentially expressed genes, with 86 overlapping genes (online supplemental figure S3C). STRING analysis generated a protein-protein interaction (PPI) network (online supplemental figure S3D, table S5). The Gene Ontology (GO) analysis of the 86 genes showed involvement in external stimuli response, lysosomal membrane and immune receptor activity (figure 3A,B, online supplemental table S6).
Supplementary data

Expression of activating transcription factor 3 (Atf3) in ischaemia-reperfusion brain tissue and microglia. (A, B) Enrichment bubble and circos plots showing GO analysis of 86 intersecting genes. (C) t-SNE clustering plot illustrating the expression of Atf3 in cells from sham and mouse middle cerebral artery occlusion/reperfusion (MCAO/R) samples. (D) Violin plots displaying the expression of Atf3 in sham and samples on days 1, 7 and 14 after MCAO/R. (E) qRT-PCR analysis of Atf3 expression in brain tissue at different time points after arterial occlusion/reperfusion, with n=5 for each time point. (F) Western blot analysis (top) and quantification (bottom) of Atf3 expression in mouse brain homogenate at designated time points after MCAO/R injury, with n=5 for each time point. (G, H) Immunofluorescence staining showing the expression of Atf3 (red) in the adult mouse cerebral cortex, hippocampal CA1 region and striatum at 2 hours after MCAO surgery and 3 days of reperfusion, labelled with Iba-1 (green) to mark microglia and cell nuclei (4',6-diamidino-2-phenylindole (DAPI)), scale bar=50 µm. (I) qRT-PCR analysis of Atf3 mRNA expression levels in primary cultured microglia, astrocytes and neurons. (J) Western blot analysis (top) and quantification (bottom) of Atf3 expression in homogenates of primary cultured microglia subjected to oxygen-glucose deprivation (OGD) and reoxygenation, with n=3 experiments. (K) Immunofluorescence staining showing the expression of Atf3 (red) with DAPI (blue, nucleus) labelling, scale bar=25 µm. *p<0.05, cell experiments repeated at least three times.
Single-cell analysis indicated interactions between microglia and neurons, with high Atf3 expression post-MCAO/R (figure 3C). t-SNE analysis showed lower Atf3 expression in astrocytes and neurons but higher levels in microglia, with microglial Atf3 expression decreasing 1 day post-MCAO/R and increasing over time (figure 3D).
In a cerebral ischaemia-reperfusion model via MCAO surgery, Atf3 mRNA and protein levels increased post-reperfusion, peaking at 3 days (figure 3E,F). Immunofluorescence showed increased Atf3 expression in microglia within the cortex, hippocampal CA1 and striatum (figure 3G,H). In vitro, microglia, astrocytes and neurons subjected to OGD/R displayed higher Atf3 expression, with the largest increase in microglia (figure 3I). Western blot confirmed that Atf3 peaked at 12 hours (figure 3J), and immunofluorescence showed peak intensity at 12 hours (figure 3K).
Inhibition of Atf3 in microglia enhances neurotoxic effects on ischaemic neuronal death
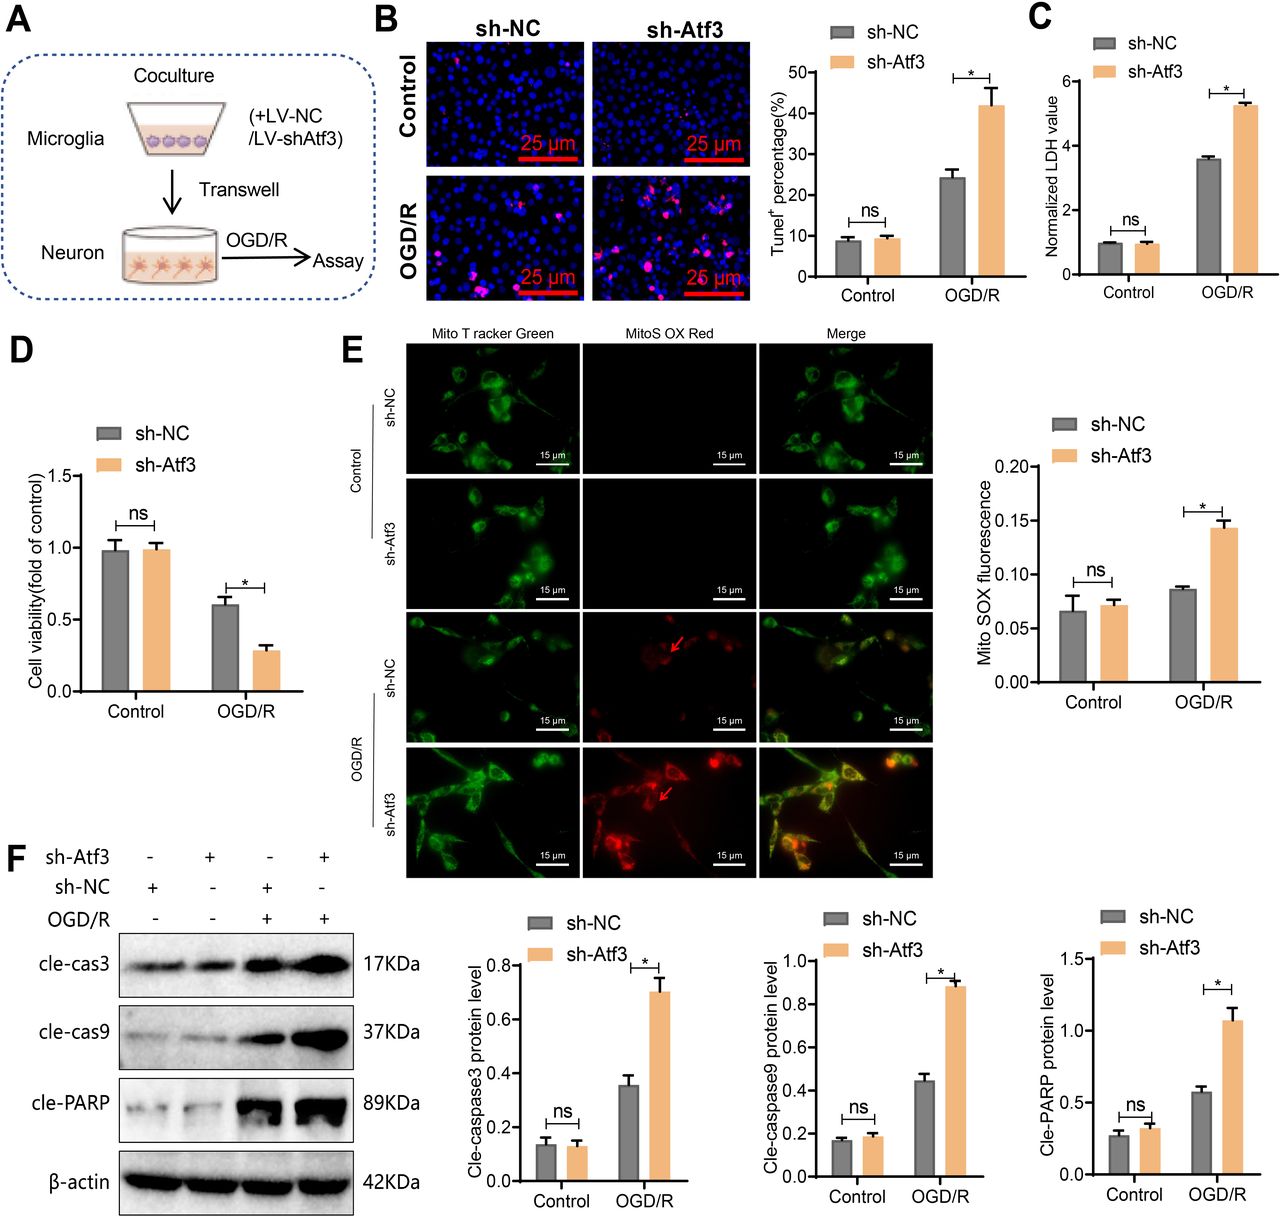
To confirm Atf3’s role in protecting neurons from ischaemia-induced death, microglia were infected with LV-sh-Atf3 lentivirus, and the most effective interference was selected (online supplemental figure S4A,B). A co-culture system of microglia and neurons was established (figure 4A). TUNEL staining showed that Atf3 knockdown in microglia increased neuronal apoptosis (figure 4B). Lactate Dehydrogenase (LDH) detection demonstrated enhanced LDH release in the sh-Atf3 group (figure 4C), while the CCK-8 assay indicated reduced neuronal viability (figure 4D). MitoSOX Red staining revealed increased ROS production in neurons (figure 4E), and western blot analysis showed elevated levels of pro-apoptotic molecules, including cleaved caspase-3, caspase-9 and PARP, in neurons (figure 4F).

Neurotoxic effect of primary microglia-induced co-culture with neurons by activating transcription factor 3 (Atf3) induction. (A) Schematic diagram of primary microglia treated with LV-sh-NC or LV-sh-Atf3 and co-cultured with neurons via the Transwell system during OGD/R. (B) TUNEL staining shows neuronal apoptosis, scale bar=25 µm. (C) Quantification of cell death by measuring LDH release. (D) Assessment of neuronal viability using the CCK-8 assay. (E) Live-cell staining of ROS production in neurons using MitoSOX Red (superoxide) and MitoTracker Green (mitochondria). Merged images show the co-localisation of MitoTracker Green and MitoSOX Red. Scale bar=15 µm. Quantitative analysis was performed using ZEISS Zen lite software, calculating the ratio of average MitoSOX fluorescence intensity to average MitoTracker green fluorescence intensity in 100 cells per group. (F) Detection of cleaved caspase-3, cleaved caspase-9 and cleaved PARP levels in neurons by western blot. *p<0.05, cell experiments repeated at least three times.
Deletion of microglial Atf3 exacerbates cerebral MCAO/R injury
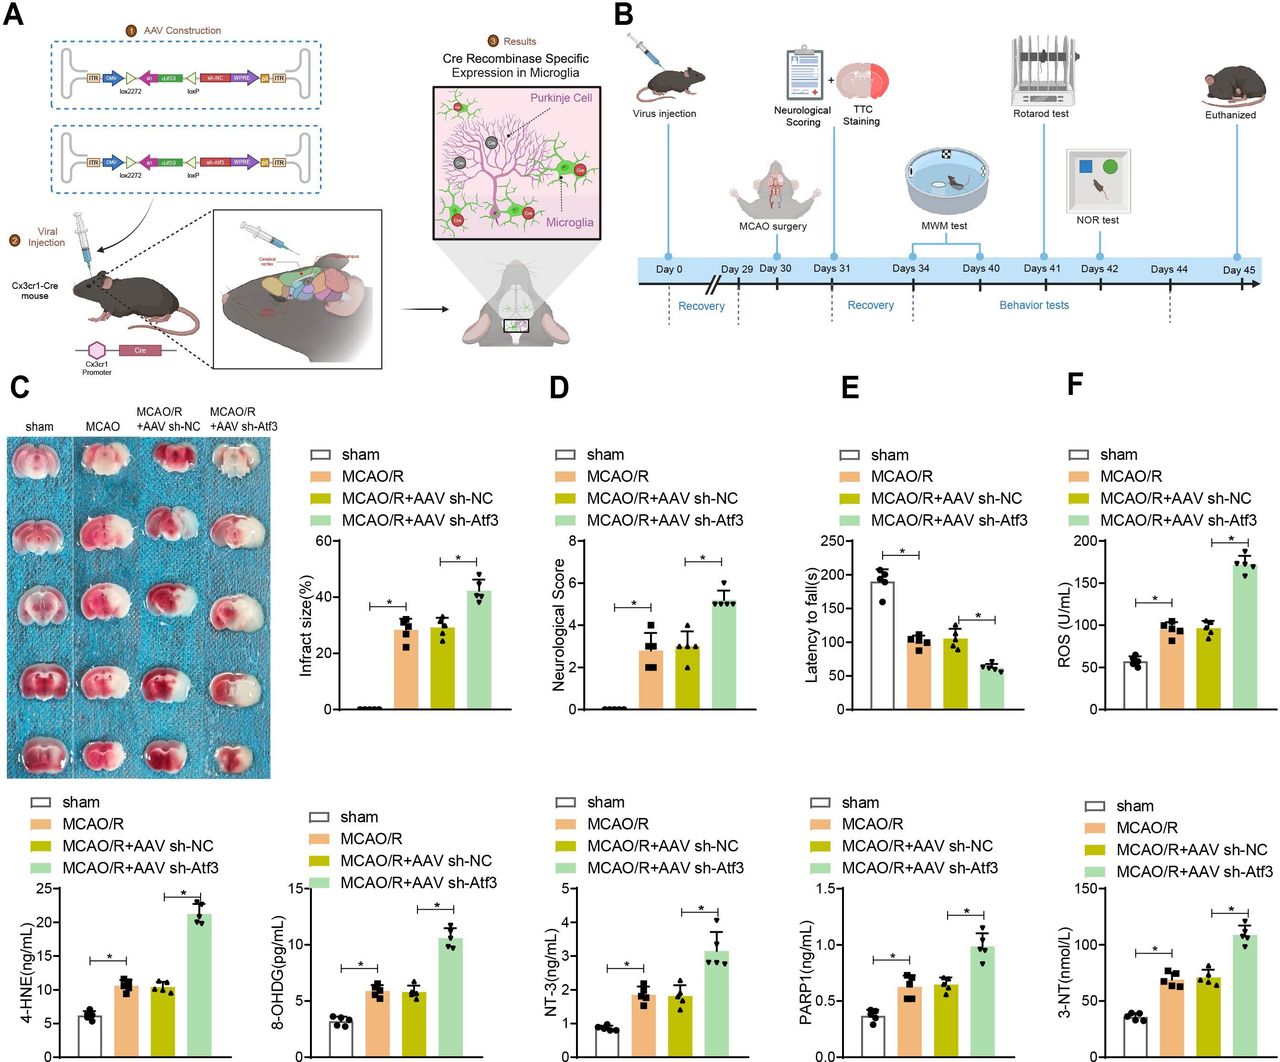
The AAV vector was injected into the cortex, hippocampal CA1 and striatum of adult male Cx3cr1-Cre mice, confirming Cre recombinase expression in microglia (figure 5A). Microglia isolated from injected mice showed decreased Atf3 mRNA and protein levels (online supplemental figure S4C,D). After MCAO reperfusion, increased infarct volume (figure 5B) and worsened neurobehavioural deficits (figure 5C) were observed in the AAV sh-Atf3 group.

Impact of microglial activating transcription factor 3 (Atf3) knockdown on neuronal behavioural function and oxidative damage after mouse middle cerebral artery occlusion/reperfusion (MCAO/R) injury. (A) Experimental design for microglial-specific knockout of wild-type Atf3, with a stereotaxic injection of AAV2/6 vector encoding CMV-DIO-EGFP-U6-s-hAtf3 (or CMV-DIO-EGFP-U6-sh-NC) into the hippocampal CA1 region, cerebral cortex and striatum of Cx3cr1-Cre mice. (B) Schematic diagram of the experimental procedure. (C) 2,3,5-Triphenyl tetrazolium chloride (TTC) staining of mouse brain slices after MCAO/R, with quantification of infarct volume (d) .(D) Assessment of neurological deficit scores after MCAO/R. (E) Rotarod test and (F) ELISA detection of expression of oxidative damage-related markers ROS, 4-HNE, 8-OHDG, NT-3, PARP1 and 3-NT. n=5. *p<0.05.
In the Morris water maze, AAV sh-Atf3 mice took longer to find the platform (online supplemental figure S5A,B) and spent less time in the target quadrant (online supplemental figure S5C), with fewer platform crossings (online supplemental figure S5D). In the novel object recognition test, AAV sh-Atf3 mice spent less time exploring the novel object (online supplemental figure S5E). The rotarod test showed shorter rotation durations in the AAV sh-Atf3 group (figure 5D). ELISA results indicated higher levels of oxidative damage markers, including ROS, 4-HNE and 8-OHDG, in the MCAO/R+AAV sh-Atf3 group (figure 5F).
Atf3 exhibits neuroprotective effects through the regulation of Lonp1 expression and activation of signalling pathways
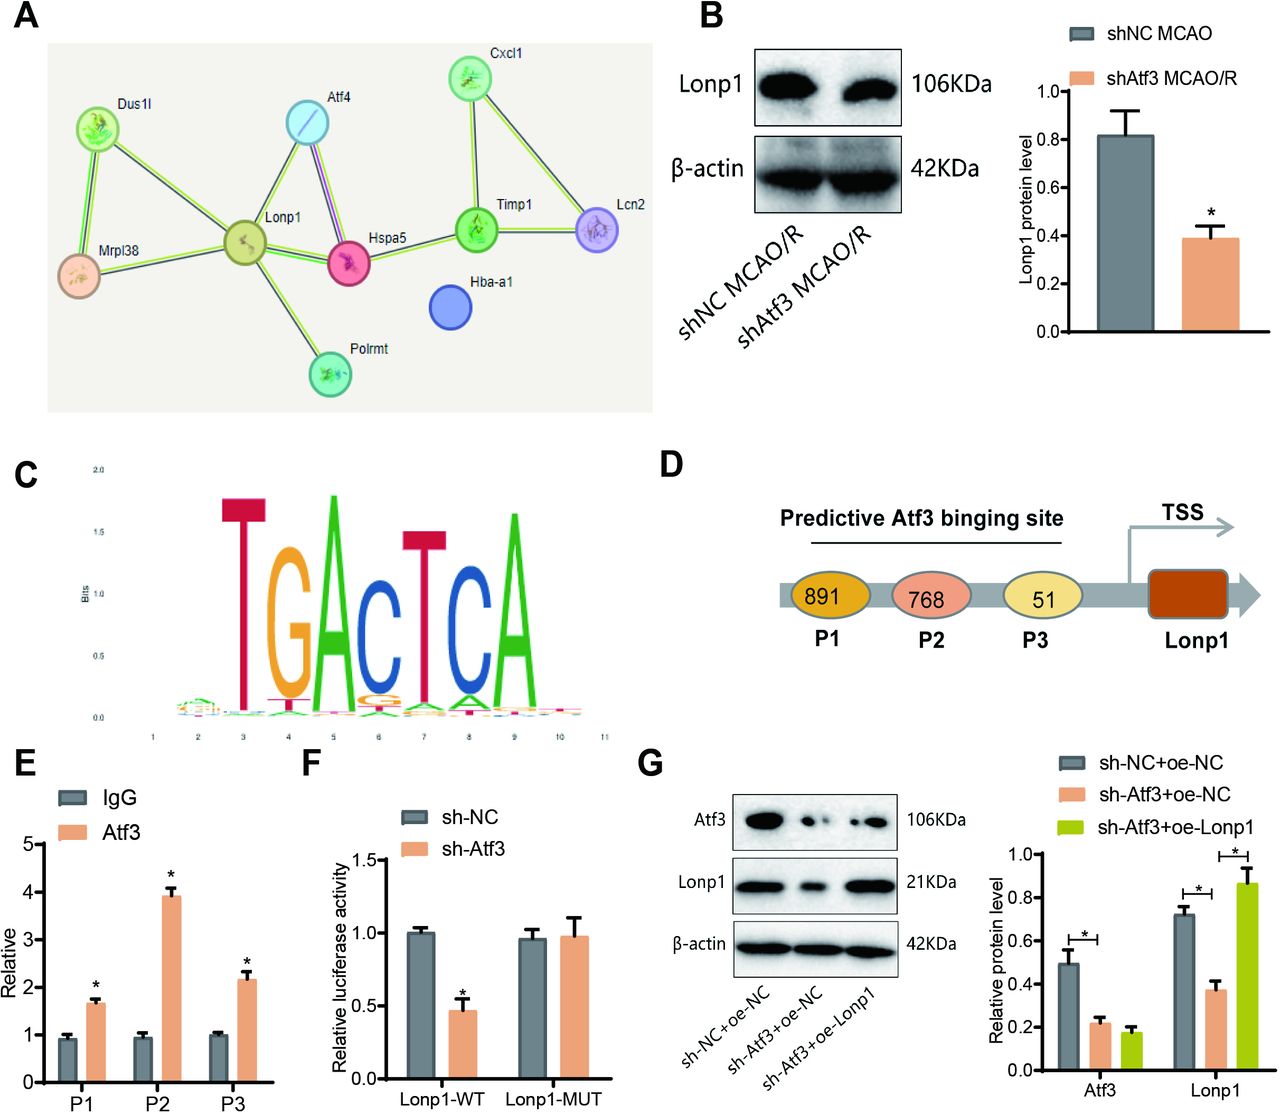
The protein targets of Atf3 in CIRI remain unclear. We used nano-HPLC-MS/MS and DIA quantitative proteomics to analyse ischaemic brain tissue from shNC and sh-Atf3 mice 3 days post-MCAO/R. Differentially expressed proteins (DEPs) were filtered (p<0.05, |logFC|>1.0), identifying 41 DEPs in MCAO/R versus sham, and 28 in sh-Atf3_MCAO/R vs shNC_MCAO/R (online supplemental figure S6A,B). A Venn diagram revealed 10 co-expressed DEPs (online supplemental figure S6A,B; figure 6A). STRING analysis suggested Lonp1-related interactions (figure 6B), with reduced Lonp1 expression in the sh-Atf3 group. The protein structures are illustrated in online supplemental figure S7A. ChIP-Base indicated a positive Atf3-Lonp1 correlation (online supplemental figure S7B–D). Three hypothetical Atf3 binding sites (P1–P3, online supplemental figure S7E) in the Lonp1 promoter were identified via JASPAR. ChIP-qPCR showed higher Atf3 enrichment at the P2 site (figure 6D,E). A dual-luciferase assay showed Atf3 knockdown reduced Lonp1-WT activity (figure 6F). Western blot validated Atf3 activation of Lonp1 expression (figure 6G).

Transcriptional regulation of lon protease homolog 1 (Lonp1) by activating transcription factor 3 (Atf3) . (A) Average escape latency in the Morris water maze test from day 1 to day 6. (B) Latency to reach the hidden platform on day 6. (C) Time (in seconds) spent in the target quadrant during the probe trial on day 7. (D) Number of crossings over the target platform location during the probe trial on day 7. (E) Representative swim tracks on day 7. (F) Novel object recognition (NOR) test, exploration time during the familiarisation phase, and the percentage of time spent exploring the novel object during the test phase. n=5. *p<0.05. (G) Western blot analysis of Lonp1 expression.
Effects of Atf3 knockdown and Lonp1 overexpression on neuronal mitochondrial metabolism and injury
Lonp1 regulates mitochondrial metabolism, dynamics and bioenergetics.23 We co-cultured Atf3-knockdown microglia with Lonp1-overexpressing neurons during OGD/R treatment (figure 7A). MitoSOX staining and flow cytometry showed increased superoxide levels in the sh-Atf3+oe NC group (figure 7B,C). TMRE and JC-1 assays indicated mitochondrial hyperpolarisation (figure 7D,E). Electron microscopy revealed mitochondrial abnormalities and fragmentation in 78% of neurons (figure 7F). Lonp1 overexpression reversed these mitochondrial defects and neuronal injury (online supplemental figure S8).

Effects of the activating transcription factor 3 (Atf3)/lon protease homolog 1 (Lonp1) axis on neuronal mitochondrial inner membrane abnormalities and mitochondrial hyperpolarisation. (A) Diagram illustrating the co-culture of primary microglia and neurons for OGD/R experiments. (B) Live-cell staining of neurons with MitoSOX Red (superoxide) and MitoTracker Green (mitochondria). The merged images show the colocalisation of MitoTracker Green and MitoSox Red. Scale bar: 15 µm. Quantitative analysis was performed using ZEISS Zen lite software to determine the ratio of average MitoSOX fluorescence intensity to average MitoTracker green fluorescence intensity in 100 cells per group. (C) Representative histogram of MitoSOX flow cytometry analysis and quantification of MitoSOX-positive cells. (D) Representative image of TMRE staining in neurons. Scale bar: 25 µm. (E) Flow cytometry analysis of mitochondrial membrane potential using JC-1 dye, the aggregated JC-1 was recorded at 590 nm emission in the PE-A channel, and the monomeric JC-1 was recorded at 529 nm emission in the FITC channel. (F) Transmission electron microscopy (TEM) images of mitochondria. The lower image is magnified more, with a scale bar of 1 µm/ 500 nm. Red arrows, compressedOM, compressed crista (CC); yellow arrows, vacuolar membrane structures. IM, inner membrane, crista; m, mitochondrial matrix; OM, outer membrane. Cell experiments were independently repeated three times. *p<0.05.
Discussion
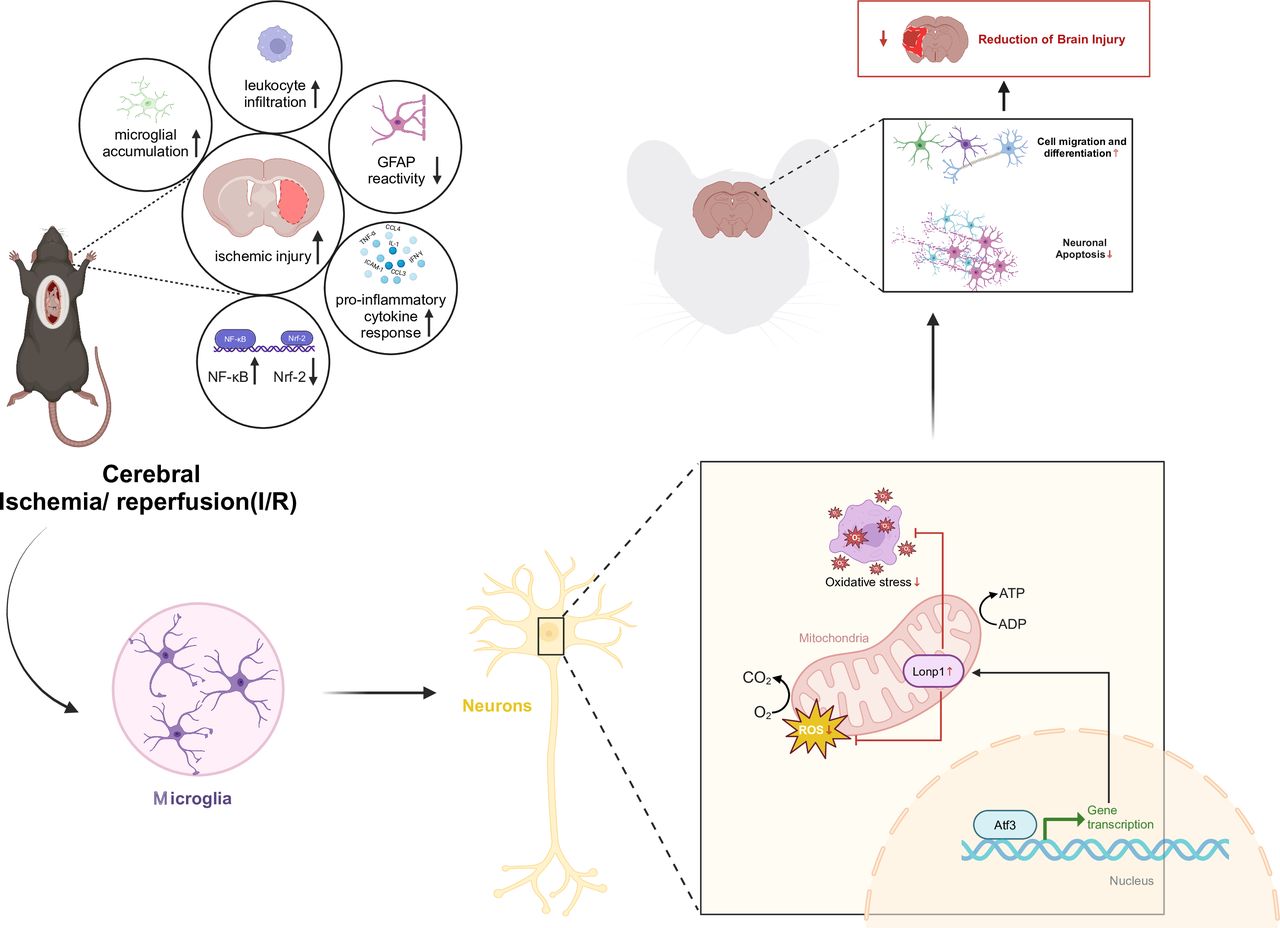
Our study uncovered a neuroprotective Atf3→Lonp1 pathway during ischaemia-reperfusion, showing reduced superoxide levels, apoptosis and brain damage (figure 8). Single-cell RNA analysis emphasised microglial involvement in CIRI, shedding new light on disease progression. Increased Atf3 in microglia suggests its role in inflammation and neuron-microglia interactions.

Molecular mechanism of transcription factor activating transcription factor 3 (Atf3) -mediated transcriptional activation of lon protease homolog 1 (Lonp1) protein expression to alleviate cerebral ischaemia-reperfusion injury.
The upregulation of Atf3 may regulate microglial immune responses, potentially influencing the release of inflammatory factors or signalling pathways, similar to Nrf2 and HIF-1α.24 This modulation may shift microglia from pro-inflammatory to anti-inflammatory, explaining Atf3’s neuroprotective role in later stages of ischaemia-reperfusion injury. Atf3 expression peaks on the third day post-ischaemia, aligning with microglia’s transition to a reparative, neuroprotective phenotype.25 This suggests a link between Atf3 expression and microglial immune phenotype changes during neural repair.
Our in vitro experiments showed that interfering with Atf3 increases microglial neurotoxicity towards neurons, highlighting Atf3’s role in CIRI, particularly in pro-inflammatory microglia.26 This finding aligns with earlier studies but offers a more detailed mechanistic insight.27 In vivo experiments revealed that knocking down Atf3 in microglia worsened neurobehavioural deficits and oxidative damage after CIRI, supporting Atf3’s inhibitory role in CIRI. These results underscore Atf3’s biological significance in reducing CIRI damage.28
Our proteomic analysis revealed Atf3’s regulatory role on Lonp1, a mitochondrial protease essential for mitochondrial function. This highlights a new link between Atf3 and mitochondrial function, especially in CIRI, distinguishing it from prior studies.6 Previous research has shown that decreased Lonp1 expression during ischaemia-reperfusion is linked to mitochondrial dysfunction, oxidative stress and apoptosis.19 Reduced Lonp1 in neurons impairs mitochondrial function, increasing apoptosis and exacerbating neuronal damage.29
Although Atf3 upregulation in microglia promotes neuroprotection, this effect depends on factors like timing, inflammation and cell signalling. The ischaemia-reperfusion process requires Atf3 to act within specific time windows, and delayed treatment or complex pathology can impair neural repair. Inflammatory responses such as tumour necrosis factor-α, interleukin (IL)-1β and IL-6 may counteract Atf3’s effects by influencing the Atf3/Lonp1 pathway, while nuclear factor-κB and JAK-STAT pathways might introduce conflicting interactions, complicating the overall pathological outcome.30
Conclusions
This study provides new insights into the molecular mechanisms of CIRI, particularly in the regulatory mechanisms of Atf3 and Lonp1. Despite its limitations, this research holds significant scientific and clinical value, offering beneficial references and prospects for future disease treatment studies.
Data availability statement
Data are available upon reasonable request. The data underlying this article will be shared on reasonable request to the corresponding author.
Ethics statements
Patient consent for publication
Ethics approval
The study was approved by the Animal Ethics Committee of Huashan Hospital, Fudan University (KY2024-1363), and performed strictly with the Guide for the Care and Use of Laboratory animals published by the US National Institutes of Health.
Footnotes
WF and MZ are joint first authors.
JT, WS and BY contributed equally.
Contributors WF and MZ designed the study. LZ and JdT collated the data, carried out data analyses and produced the initial draft of the manuscript. JyT, WS and BY contributed to drafting the manuscript. All authors have read and approved the final submitted manuscript. JyT and WS are responsible for the overall content as guarantors.
Competing interests None declared.
Provenance and peer review Not commissioned; externally peer reviewed.
Supplemental material This content has been supplied by the author(s). It has not been vetted by BMJ Publishing Group Limited (BMJ) and may not have been peer-reviewed. Any opinions or recommendations discussed are solely those of the author(s) and are not endorsed by BMJ. BMJ disclaims all liability and responsibility arising from any reliance placed on the content. Where the content includes any translated material, BMJ does not warrant the accuracy and reliability of the translations (including but not limited to local regulations, clinical guidelines, terminology, drug names and drug dosages), and is not responsible for any error and/or omissions arising from translation and adaptation or otherwise.
This is an open access article distributed in accordance with the Creative Commons Attribution Non Commercial (CC BY-NC 4.0) license, which permits others to distribute, remix, adapt, build upon this work non-commercially, and license their derivative works on different terms, provided the original work is properly cited, appropriate credit is given, any changes made indicated, and the use is non-commercial. See: http://creativecommons.org/licenses/by-nc/4.0/.
References


