

Abstract
Background and objective We investigated the association of APOE alleles with CT-based cerebral amyloid angiopathy (CAA) markers including subarachnoid extension (SAE) and finger-like projection (FLP).
Methods We included patients with acute primary supratentorial intracerebral haemorrhage (ICH) from a multicentre cohort in China. First, the association of APOE with ICH location (lobar vs non-lobar) was evaluated. Next, the relationships of APOE with SAE, FLP, and the coexistence of the two (SAE+FLP) were evaluated.
Results 533 patients with supratentorial ICH were enrolled. Among them were 138 patients with lobar ICH and 395 with non-lobar ICH. Compared with the non-lobar group, APOE ε4 (OR 1.894, 95% CI 1.138 to 3.154, p=0.014) and ε2/ε4 (OR 6.098, 95% CI 1.414 to 26.293, p=0.015) were associated with lobar ICH. With regard to CAA markers, APOE ε2 was associated with SAE (OR 2.109, 95% CI 1.167 to 3.810, p=0.013), ε4 was associated with FLP and SAE+FLP (OR 3.026, 95% CI 1.353 to 6.767, p=0.007; OR 3.514, 95% CI 1.485 to 8.316, p=0.004, respectively) and ε2/ε4 was associated with all three factors (SAH: OR 7.599, 95% CI 1.764 to 32.734, p=0.006; FLP: OR 20.333, 95% CI 3.278 to 126.137, p=0.001; SAE+FLP: OR 30.568, 95% CI 4.460 to 209.503, p<0.001) after adjusting for age, and remained significant after adjusting for age and ICH volume.
Conclusion In patients with spontaneous supratentorial ICH, APOE ε2 and ε4 alleles were associated with SAE and FLP, respectively, suggesting APOE allele-specific effects on CT markers of CAA and their potential mechanisms.
WHAT IS ALREADY KNOWN ON THIS TOPIC
Subarachnoid extension (SAE) and finger-like projection (FLP) may be biomarkers for the risk and severity of cerebral amyloid angiopathy (CAA)-associated intracerebral haemorrhage (ICH), but the mechanism of these neuroimaging manifestations is still unclear, and clarifying the associations between apolipoprotein E (APOE) genotype and SAE or FLP may be helpful.
WHAT THIS STUDY ADDS
In patients with supratentorial ICH, APOE ε2 was associated with SAE, APOE ε4 was associated with FLP and SAE+FLP and ε2/ε4 heterozygosity was associated with all three.
HOW THIS STUDY MIGHT AFFECT RESEARCH, PRACTICE OR POLICY
This study revealed that different APOE alleles have different effects on CT markers of CAA, suggesting different pathophysiological processes.
Background
Spontaneous intracerebral haemorrhage (ICH) is a critical disease which accounts for 20% of all strokes, with high mortality and morbidity (approximately 50% and 30%, respectively).1 2 Incidence of ICH is expected to remain significant with the ageing of the population and the extensive use of anticoagulant drugs.3
The majority of primary ICH are caused by two common cerebral small vessel diseases, arteriolosclerosis and cerebral amyloid angiopathy (CAA).3 Arteriolosclerosis, related to hypertension, often involves the perforator arteries of the basal ganglia and brainstem and thus causes deep territories bleeding; CAA mainly refers to the deposition of β-amyloid in the walls of arterioles and capillaries in the pia mater and cortex, which causes lobar ICH.3 The risk of recurrence in patients with CAA-associated ICH is 7.4%/year, which is greater than that of non-CAA-associated ICH patients (1.1%/year).3
CAA imaging markers based on CT have been developed.4 The pathologically validated Edinburgh CT diagnostic criteria include the subarachnoid extension (SAE) and finger-like projection (FLP).5–7 In patients with CAA, SAE seems to be associated with the increased risk of incidence and recurrence of ICH.8–11 Compared with patients with SAE or FLP alone, patients with SAE combined with FLP have more severe ICH at onset, higher in-hospital case-fatality and higher mRS scores at discharge.12Thus, SAE and FLP may be biomarkers for the risk and severity of CAA-associated ICH, but the mechanism of these neuroimaging manifestations is still unclear, and clarifying the associations between apolipoprotein E (APOE) genotype and SAE or FLP may be helpful. The APOE genotype is an important genetic risk factor for ICH and associated with the prognosis.13–15 The APOE ε4 allele is associated with CAA, while APOE ε2 is associated with the severity of ICH.13 16 17 The two APOE alleles may play different roles in the pathogenesis of CAA, that is, APOE ε4 promotes the deposition of β-amyloid in blood vessels, APOE ε2 increases the damage of vessel wall caused by amyloid deposition and the ε2/ε4 genotype may represent a double hit to superficial blood vessels, which promotes both deposition of amyloids and also wall rupture of the most fragile arterioles in CAA.18 19 APOE is speculated to also mediate the selective distribution of β-amyloid, that is, APOE ε4 favours cortical CAA and ε2 is associated with leptomeningeal CAA.20 Cortical superficial siderosis (cSS, considered as a chronic manifestation of SAE) is associated with APOE ε2,18 20–22 and an association between SAE and ε2 has also been observed in patients with supratentorial ICH, though these data were obtained from small studies.23 As for the relationship between FLP and APOE, only one study has shown that FLP in patients with lobar ICH is associated with ε4 and ε2/ε4 heterozygosity; surprisingly, no association was observed between SAE and APOE in this study.24
To date, there is no consistent conclusion about the association between APOE and SAE or FLP. On this basis, we hypothesised that different APOE alleles were associated with these two markers, which we tested in an ICH patient cohort.
Methods
Research settings
We included patients from a prospective multicentre cohort of acute primary ICH patients recruited from 19 hospitals in Beijing, Hebei and Inner Mongolia between 2015 and 2019 (NCT number (REDACTED)). The main inclusion criteria of this study were as follows: (1) primary spontaneous supratentorial ICH and (2) available APOE genotype. Patients were excluded if they had any of the following characteristics: (1) secondary haemorrhage, such as vascular malformation, trauma, tumour or haemorrhagic transformation in ischaemic stroke; (2) absence of non-contrast CT within 7 days after the onset of symptoms or low-quality image or (3) head surgery performed before baseline CT.
Data collection
The demographic and clinical data were systematically and prospectively collected and recorded by trained neurologist at the time of index symptomatic ICH and included age, sex, vascular risk factors, patient medication history before ICH, previous ICH history and family history according to the medical records or description from patients or their relatives. The National Institutes of Health Stroke Scale (NIHSS) Score at admission was evaluated.
Genotyping
The APOE genotype was determined from blood samples donated by patients at enrolment. DNA was extracted from blood samples. Two loci of the APOE gene (rs429358 and rs7412) were detected and translated into APOE genotypes (ε3/ε3, ε3/ε4, ε4/ε4, ε3/ε2, ε2/ε2 and ε2/ε4). Genotyping was performed by laboratory staff blinded to the clinical and neuroimaging data. APOE alleles were classified by their presence or absence (dominant model) and allele count (additive model) and ε2/ε4 heterozygosity was observed.24
Image acquisition and analysis
CT scans were reviewed by radiologists blinded to both the clinical data and APOE genotype to determine the location and volume of ICH and the presence or absence of intraventricular haemorrhage. The location of ICH was defined as supratentorial (lobar and deep), or infratentorial (brainstem and cerebellum) using the cerebral haemorrhage anatomical rating instrument (CHARTS).25 The volume of ICH was calculated from the baseline CT images using the ABC/2 method.
The presence of SAE and FLP was assessed in the CT axial plane according to the Edinburgh diagnostic criteria and both written and pictorial definitions were used to improve accuracy; SAE was defined as an extra-axial haemorrhage in the subarachnoid space, while FLP was defined as elongated extensions arising from the haematoma, longer than wide, with or without the extension to the cortex (figure 1).5 The assessment was independently performed by two experienced investigators (QY and XZ) also blinded to both the clinical data and APOE genotype. The inter-rater agreement was good for cSAH presence (kappa=0.756), as well as for FLP (kappa=0.780). Discrepancies were settled by consensus after the investigators read all of the scans. Patients with CT within 7 days after the onset of symptoms were included, as patients with CT up to 7 days were included in the study of Edinburgh criteria.5

Examples of subarachnoid extension (SAE, black arrow) and finger-like projections (FLP, white arrow). FLP, finger-like projection; SAE, subarachnoid extension.
Statistical analysis
Due to the nature of the underlying distributions, continuous variables are presented as medians with IQR (first quartile to third quartile). Categorical variables are expressed as n (%). First, univariate and age-adjusted multivariate logistic regression analyses were used to evaluate the association between APOE and ICH location (non-lobar vs lobar). Second, in all supratentorial ICH patients, the association between APOE and the presence of CAA neuroimaging markers (ie, SAE, FLP and SAE+FLP), using participants without either SAE or FLP as the comparator group, was analysed using univariate and multivariate logistic regressions (adjusting for age, and adjusting for age and ICH volume, respectively). Third, factors associated with SAE, FLP, SAE+FLP were identified using multivariable analysis including two kinds of models. In model 1, prespecified plausible predictors (including age, ICH volume, ICH location and APOE) as well as variables with a p value<0.1 in univariable regression were included for multivariable logistic regression. In model 2, same variables as model 1 were included, and backward (conditional) logistic regression was used. Fourth, subgroup analyses by location that is, lobar ICH and non-lobar ICH were further performed. Statistical significance was defined as p<0.05. All analyses were performed with SPSS (V.26.0).
Results
Study population
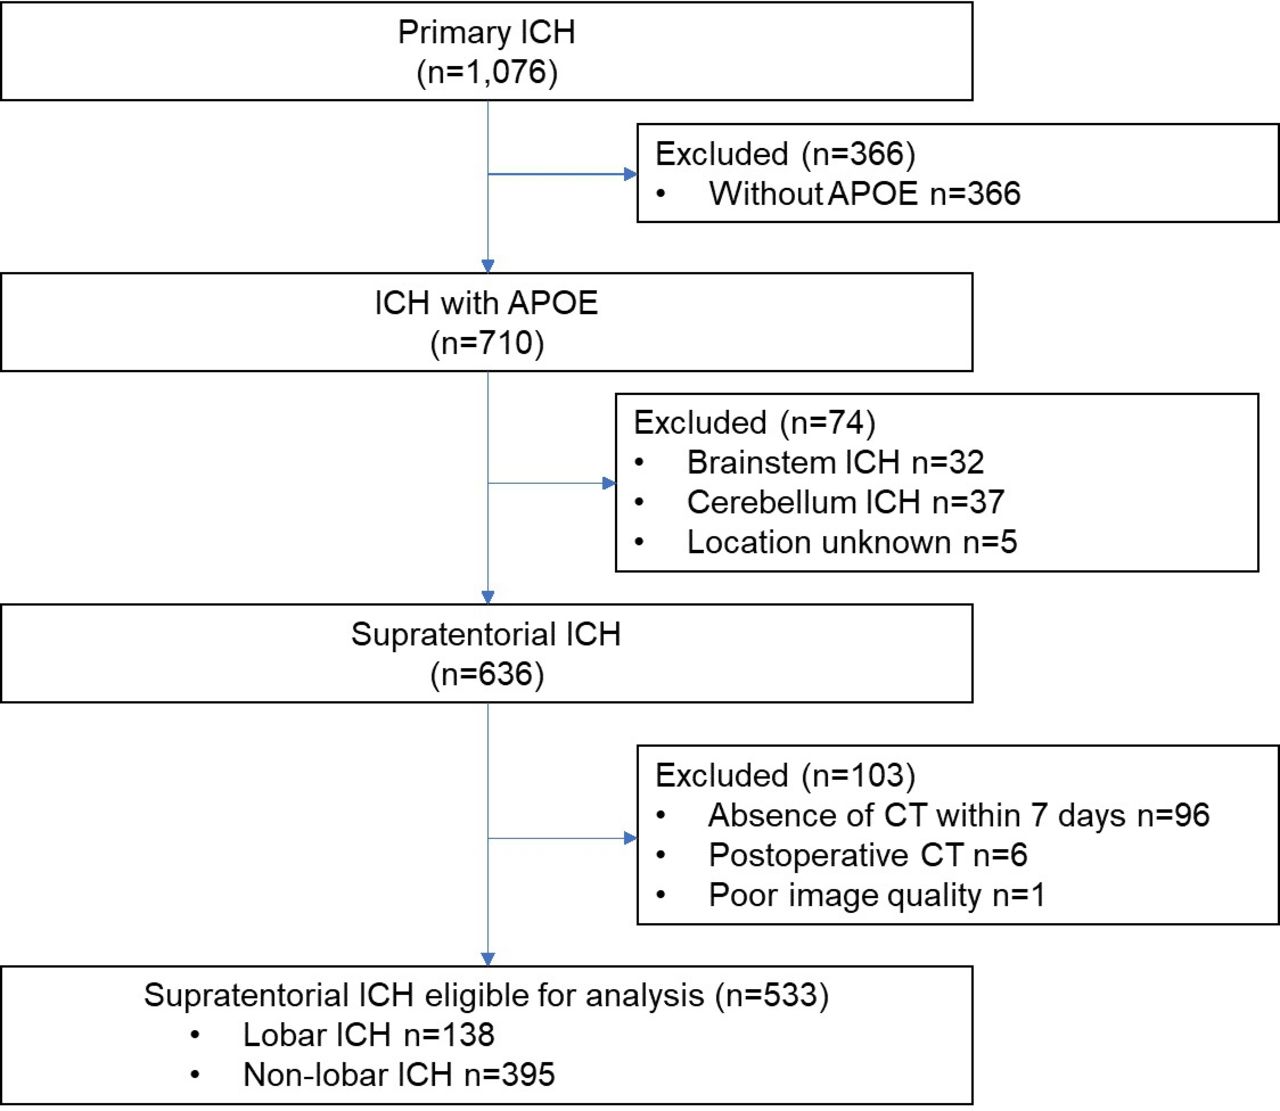
A total of 533 patients were eligible for analysis, with a median age of 61 (52, 74) years and 355 males (66.6%). Among them were 138 patients with lobar ICH and 395 patients with non-lobar ICH. Figure 2 shows the flow chart of patient inclusion. Compared with the included patients, the excluded patients had more hypertension, and fewer family history of ICH, while there were no significant differences in remaining characteristics (online supplemental table S1).
Supplementary data

Study flowchart. ; APOE, apolipoprotein E; ICH intracerebral haemorrhage.
The baseline characteristics and the APOE allele frequency of CT markers including SAE and FLP of all patients and patients by ICH location are shown in tables 1 and 2. SAE, FLP and SAE+FLP were present in 86 (16.1%), 37 (6.9%) and 31 (5.8%) patients, respectively. Compared with the non-lobar ICH group, the lobar ICH group were older, had fewer hypertension, more previous ICH and greater ICH volume, as well as more SAE, FLP and SAE+FLP (table 1). The characteristics of patients with or without SAE, FLP and SAE+FLP were shown in online supplemental table S2.
Baseline characteristics of patients with ICH (all, lobar and non-lobar)
APOE allele frequency of CAA neuroimaging biomarkers in patients with ICH (all, lobar and non-lobar)
APOE and ICH location
Compared with non-lobar ICH, APOE ε4 as a dominant variable was associated with lobar ICH (OR 1.894, 95% CI 1.138 to 3.154, p=0.014) in the age-adjusted multivariate analysis. This risk increased with the increasing allele count (additive model, overall p=0.004). APOE ε2/ε4 was also associated with lobar ICH (OR 6.098, 95% CI 1.414 to 26.293, p=0.015) (table 3).
Association of APOE with ICH locations
APOE and imaging markers in all ICH
APOE and SAE in all ICH
The APOE genotype associated with SAE included APOE ε2 as a dominant variable (OR 2.109, 95% CI 1.167-3.810, p = 0.013), an additive variable (overall p = 0.046) and APOE ε2/ε4 (OR 7.599, 95% CI 1.764-32.734, p = 0.006) after adjusting for age, and remained significant after adjusting for age and ICH volume (table 4).
Association of APOE with CT neuroimaging markers in all supratentorial ICH
In a sensitivity analysis that adjusting for age, hypertension, smoker, previous ICH, ICH volume, ICH location and intraventricular haemorrhage, APOE ε2 as a dominant variable was associated with SAE (OR 2.436, 95% CI 1.094 to 5.425, p = 0.029), while neither APOE ε2 as an additive variable nor APOE ε2/ε4 was associated with SAE significantly (overall p = 0.068; p = 0.197, respectively) in all supratentorial ICH patients (online supplemental table S3).
APOE and FLP in all ICH
The APOE genotype associated with FLP included APOE ε4 as a dominant variable (OR 3.026, 95% CI 1.353 to 6.767, p=0.007), and APOE ε2/ε4 (OR 20.333, 95% CI 3.278 to 126.137, p=0.001) after adjusting for age, and remained significant after adjusting for age and ICH volume (table 4).
In a sensitivity analysis that adjusting for age, hypertension, previous OAC use, previous ICH, ICH volume and location, APOE ε4 as a dominant variable was associated with FLP (OR 2.886, 95% CI 1.011 to 8.232, p = 0.048), while neither APOE ε4 as an additive variable nor APOE ε2/ε4 was associated with FLP significantly (overall p = 0.109; p = 0.065, respectively) (online supplemental table S4).
APOE and SAE+FLP in all ICH
The APOE genotype associated with SAE+FLP included APOE ε4 as a dominant variable (OR 3.514, 95% CI 1.485 to 8.316, p=0.004), APOE ε4 as an additive variable (overall p=0.017) and APOE ε2/ε4 (OR 30.568, 95% CI 4.460 to 209.503, p<0.001) in the age-adjusted multivariate analysis, and remained significant after adjusting for age and ICH volume (table 4).
In a sensitivity analysis that adjusting for age, hypertension, previous OAC use, previous ICH, ICH volume and location, APOE ε4 as a dominant variable and APOE ε2/ε4, were associated with SAE+FLP (OR 3.612, 95% CI 1.110 to 11.748, p = 0.033; OR 13.005, 95% CI 1.290 to 131.118, p = 0.030, respectively)), while APOE ε2 as an additive variable was not significantly associated with SAE+FLP (overall p = 0.075) (online supplemental table S5).
APOE and imaging markers in ICH subgroup by location
In patients with lobar ICH, the association between SAE and APOE ε2 or ε2/ε4 was not significant in the age and volume-adjusted multivariate analysis (ε2 as a dominant variable: OR 2.704, 95% CI 0.865 to 8.454, p=0.087; ε2/ε4: OR 9.333, 95% CI 0.739 to 117.837, p=0.084); APOE ε4 as a dominant variable was associated with FLP (OR 3.083, 95% CI 1.164 to 8.164, p=0.023) after adjusting for age, while not significant after adjusting for age and ICH volume (OR 2.913, 95% CI 0.958 to 8.859, p=0.060); APOE ε4 as a dominant variable was associated with SAE+FLP (OR 3.006, 95% CI 1.112 to 8.125, p=0.030) after adjusting for age, while not significant after adjusting for age and ICH volume (OR 2.951, 95% CI 0.915 to 9.517, p=0.070) (online supplemental table S6).
In patients with non-lobar ICH, there was no association observed between SAE, FLP or SAE+FLP and APOE in the univariate and multivariate analysis (online supplemental table S7).
Discussion
This multicentre ICH cohort analysis found that in patients with supratentorial ICH, APOE ε2/ε4 heterozygosity and the ε4 allele were independently associated with lobar ICH compared with non-lobar ICH. The results of APOE and CT markers showed that APOE ε2 was associated with SAE, APOE ε4 was associated with FLP and SAE+FLP and ε2/ε4 heterozygosity was associated with all three. The results showed that different APOE alleles have different effects on CT markers of CAA, suggesting different pathophysiological processes.
APOE ε4 and ε2/ε4 were associated with lobar ICH compared with non-lobar ICH in this study, which is consistent with previous results and supports the APOE genotype as a strong genetic risk factor for CAA, which is prone to cause lobar ICH.24
In this study, different CT neuroimaging markers exhibited different associations with the APOE alleles. The associations of SAE with APOE ε2 and ε2/ε4 heterozygosity further validate and expand the results of previous studies.23The associations of FLP with APOE ε4 and ε2/ε4 heterozygosity are consistent with a previous study, which mainly included Caucasians with lobar ICH.24 Thus, our findings validate these results in Chinese patients with supratentorial ICH. FLP rarely occurs alone in patients with lobar ICH and is mostly accompanied by SAE.12 Compared with patients with only one CT marker or none, patients with both SAE and FLP had more severe ICH (including higher ICH volume and higher NIHSS score) and a poorer prognosis (more in-hospital deaths and higher modified Rankin scale score).12 When we further analysed the relationship between APOE and SAE+FLP, we found that ε4 and ε2/ε4 heterozygosity were associated with it, which was not found in previous studies.
These findings suggest that APOE may affect different pathological processes of CAA, thus altering CAA-specific neuroimaging biomarkers. CAA has two pathological subtypes: CAA type 1 (parenchymal-predominant), characterised by amyloid in cortical capillaries and associated with APOE ε4, and CAA type 2 (leptomeningeal-predominant), where amyloid is deposited mainly in the leptomeningeal and cortical arteries and related to APOE ε2.26 27 A study revealed that FLP and SAE were significantly and specifically associated with cerebral microbleeds and cSS on MRI, respectively, which indicates that FLP and SAE may be related to the different anatomical distributions of CAA pathology: FLP may represent the parenchymal-predominant CAA (indicated by strictly lobar cerebral microbleeds), while SAE may represent the leptomeningeal-predominant CAA (indicated by cSS).24 28 A meta-analysis revealed a strong association between APOE ε2 genotype and cSS which is believed to be the chronic manifestation of episodes of SAE.18 20 Therefore, mechanistically, ε2 may cause CAA of the leptomeningeal and cortical vessels and thus SAE. On the other hand, FLP may be a biomarker of more severe capillary CAA, which raises the likelihood of ICH dispersion into brain tissue, presumably driven by ε4(24).
The strengths of this study include its use of a multicentre cohort and the use of standardised assessments of CAA-associated neuroimaging markers. This study analysed patients with supratentorial ICH rather than only lobar ICH, because the anatomical classification of ICH locations was not perfectly reliable, for example when an ICH is very large and extends into both lobar and non-lobar areas or multiple ICH including both areas. In addition, the analysis of ε2/ε4 heterozygosity showed that the association between ε2/ε4 and SAE was strong (OR=8.855), 3.6 times that of ε2 carrier status (OR=2.437), suggesting that the presence of the ε4 allele might augment the effect of ε2. The association between ε2/ε4 and FLP was strong (OR=30.129), 9.1 times that of ε4 carrier status with FLP (OR=3.314), suggesting that ε2 might increase the effect of ε4. Analysis of the presence of FLP+SAE showed that its association with ε2/ε4 (OR=70.360) was 14.3 times that of ε4 carrier statis (OR=4.926), which suggests that ε2 and ε4 independently affect SAE and FLP, and their joint effect further supports the hypothesis of a ‘double hit’ mechanism of ε2/ε4 heterozygosity.18 Based on the clinical significance of CT markers for CAA and the unidirectionality of genes in causal inference, the APOE genotype could be an important factor in the clinical evaluation of CAA diagnosis and prognosis, especially ε2/ε4 heterozygosity, which is likely to be a strong factor, although this genotype is rare.
Our study has limitations. First, the sample size of lobar ICH patients was relatively small, which may partly explain that the associations of APOE with imaging markers in these patients showed a same direction as all supratentorial ICH but not significant. Second, only CT axial plane was used to assess FLP because coronal and sagittal planes were not available, which may underestimate the prevalence of FLP. Third, given that the frequencies of APOE alleles varied by race and ethnicity,14 15 and the patients included in our study were from north China, the results should be interpreted with caution and need to be tested and verified in larger cohorts in future. On the other hand, similar prevalence of CAA neuropathology in (lobar) ICH patients in East-Asian and Western countries29 might support the generalizability of our findings.
Conclusion
This study revealed that the APOE ε2 and ε4 alleles were associated with CT-based CAA neuroimaging markers (ie, FLP and SAE) in supratentorial ICH patients, which may indicate that different APOE alleles have different effects on the neuroimaging biomarkers and the potential pathophysiological processes.
Data availability statement
Data are available upon reasonable request.
Ethics statements
Patient consent for publication
Ethics approval
This study involves human participants. This study was approved by the Ethics Committee of Peking University Third Hospital ((2014)-191-3). Participants gave informed consent to participate in the study before taking part.
Acknowledgments
We are grateful to the patients and investigators in every centre for their involvement.
Footnotes
QY and XZ are joint first authors.
QY and XZ contributed equally.
Contributors Conceptualisation, QY and DF; data curation, QY and LT; investigation, QY, XZ, XL, LT, FG and XH; methodology, QY and NL; formal analysis, QY and NL; supervision, DF; funding acquisition, QY and DF; writing—original draft, QY and XZ; writing—review and editing, LT, KX, NL and DF. All authors have read and agreed to the submitted version of the manuscript. DF is the guarantor.
Funding National Natural Science Foundation of China (grant number 81901204) and Beijing Municipal Science and Technology Commission (grant number D141100000114005).
Competing interests None declared.
Provenance and peer review Not commissioned; externally peer reviewed.
Supplemental material This content has been supplied by the author(s). It has not been vetted by BMJ Publishing Group Limited (BMJ) and may not have been peer-reviewed. Any opinions or recommendations discussed are solely those of the author(s) and are not endorsed by BMJ. BMJ disclaims all liability and responsibility arising from any reliance placed on the content. Where the content includes any translated material, BMJ does not warrant the accuracy and reliability of the translations (including but not limited to local regulations, clinical guidelines, terminology, drug names and drug dosages), and is not responsible for any error and/or omissions arising from translation and adaptation or otherwise.
This is an open access article distributed in accordance with the Creative Commons Attribution Non Commercial (CC BY-NC 4.0) license, which permits others to distribute, remix, adapt, build upon this work non-commercially, and license their derivative works on different terms, provided the original work is properly cited, appropriate credit is given, any changes made indicated, and the use is non-commercial. See: http://creativecommons.org/licenses/by-nc/4.0/.
References


