

Abstract
Background Both genetic and lifestyle factors contribute to myocardial infarction (MI) and stroke, including ischaemic stroke (IS) and intracerebral haemorrhage (ICH). We explored how and the extent to which a healthy lifestyle, by considering a comprehensive list, could counteract the genetic risk of those diseases, respectively.
Methods 315 044 participants free of stroke and MI at baseline were identified from the UK Biobank. Genetic risk scores (GRS) for those diseases were constructed separately and categorised as low, intermediate and high by tertile. Lifestyle risk scores (LRS) were constructed separately using smoking, alcohol intake, physical activity, dietary patterns and sleep patterns. Similarly, participants were categorised into low, intermediate and high LRS. The data were analysed using Cox proportional hazard models.
Results Over a median follow-up of 12.8 years, 4642, 1046 and 9485 participants developed IS, ICH and MI, respectively. Compared with participants with low levels of GRS and LRS, the HRs of those with high levels of GRS and LRS were 3.45 (95% CI 2.71 to 4.41), 2.32 (95% CI 1.40 to 3.85) and 4.89 (95% CI 4.16 to 5.75) for IS, ICH and MI, respectively. Moreover, among participants with high GRS, the standardised 14-year rates of IS events were 4.40% (95% CI 3.45% to 5.36%) among those with high LRS. In contrast, it is only 1.78% (95% CI 1.63% to 1.94%) among those with low LRS. Similarly for MI, the high LRS group had standardised rates of 8.60% (95% CI 7.38% to 9.81%), compared with 3.34% (95% CI 3.12% to 3.56%) in low LRS. Among the high genetic risk group of ICH, the rate is reduced by about half compared low LRS to high LRS, although the rate was low for both (0.36% (95% CI 0.31% to 0.42%) and 0.71% (95% CI 0.36% to 1.05%), respectively).
Conclusion Healthy lifestyles were substantially associated with a reduction in the risk of IS, ICH and MI and attenuated the genetic risk of IS, ICH and MI by at least half, respectively.
WHAT IS ALREADY KNOWN ON THIS TOPIC
Both genetic and lifestyle factors contribute to the development of the most common cardiovascular diseases, such as myocardial infarction (MI) and stroke, including ischaemic stroke (IS) and intracerebral haemorrhage (ICH). However, previous studies have focused on limited sets of factors and categorised them in a traditional dichotomous manner with hypothesis-driven designs. The health benefits of other healthy lifestyles, individual characteristics and the likelihood of adherence remain overlooked or unknown. Additionally, previous studies have concentrated on all-cause stroke or coronary heart disease (including MI). However, the effects of genetic variants and lifestyle may vary by aetiology, even though some genetic and vascular risk factors are shared among causal factors.
WHAT THIS STUDY ADDS
We aimed to explore how a healthy lifestyle could counteract the genetic risk of IS, ICH and MI, respectively, by considering a comprehensive list of lifestyle risk factors.
HOW THIS STUDY MIGHT AFFECT RESEARCH, PRACTICE OR POLICY
A healthy lifestyle, by considering a comprehensive list, is associated with a significantly reduced risk of stroke and MI, as well as an attenuated genetic risk of these diseases. This suggests that we need to focus on a broader level of healthy lifestyles and more particular disease subtypes, rather than just key lifestyle and disease macro-classifications.
Introduction
Myocardial infarction (MI) and stroke, including ischaemic stroke (IS) and intracerebral haemorrhage (ICH), are the most common cardiovascular diseases (CVD) and are the leading causes of premature death, disability and rising healthcare costs worldwide.1 2 Fortunately, accumulating evidence has shown that MI and stroke are preventable.3 It is well documented that smoking, physical activity, diet and body mass index (BMI) are strongly associated with the risk of CVD.4–6 The American Heart Association has identified these four modifiable behaviours or factors as key measures to improve and maintain cardiovascular health.7 Well-characterised large-scale datasets provide invaluable resources for investigating other risk factors for CVD, such as sleep8 and sedentary behaviours,9 which offer new ideas for its prevention.
It is well accepted that both genetic and behavioural factors contribute to the development of CVD.10–12 Genome-wide association studies (GWAS) have identified genetic variants associated with different subtypes of stroke and MI, providing support for quantitative measurement of disease susceptibility and risk stratification at the individual level.13 14 Recently, several studies have suggested that adherence to a healthy lifestyle (including not smoking, performing physical activity, maintaining a healthy diet and maintaining a normal weight) plays a key role in attenuating the genetic risk effects of CVD, hypertension, diabetes, etc.15 However, previous studies have focused on limited sets of factors and categorised them in a traditional dichotomous manner with hypothesis-driven designs. The health benefits of other healthy lifestyles and individual characteristics remain overlooked or unknown. To increase the adoption of healthy lifestyles at the population level, we need to abandon the one-size-fits-all approach and consider a broader range of lifestyles and more detailed stratification. Additionally, previous studies have concentrated on all-cause stroke or coronary heart disease. However, the effects of genetic variants and lifestyle may vary by aetiology, even though some genetic and vascular risk factors are shared among causal factors. Assessing the potential effects of different lifestyles and genetic variants on different disease subtypes allows a more objective understanding of the relationship between the two factors and the risk of IS, ICH and MI, as well as the extent to which a healthy lifestyle mitigates genetic risk.
In this study, we construct two composite weighted scores (the genetic risk score (GRS) and the lifestyle risk score (LRS)) for IS, ICH and MI separately. We had the following aims (1) to examine the association of these two composite scores, individually and in combination, with the incident events of IS, ICH and MI and (2) to investigate the extent to which a healthy lifestyle is associated with offsetting the genetic risk.
Methods
Study participants
This study was embedded in the UK Biobank, a large-scale, population-based prospective study that recruited over 500 000 participants, aged 40–69 years, from 22 assessment centres across the UK between 2006 and 2010. It includes extensive phenotypic and genotypic details about the participants.16 For the present study, we excluded individuals who were identified as non-Caucasian (n=30 285) and with a history of stroke or MI based on self-report or medical records (n=17 201), leaving 453 452 for further analysis. Separate subsamples were constructed to examine the association of IS, ICH and MI with five integrated lifestyle categories, and participants missing a value for a specific item were removed from the analysis of that item. Ultimately, participants with missing data on lifestyle (n=1 11 483) or unpassed genetic quality control (n=26 925) were excluded from the final analysis. The flowchart for sample selection is shown in figure 1.

Flowchart for the selection of the analysed study sample from the UK Biobank study.
Lifestyle factors
In our study, the lifestyles of each participant were assessed through five integrated categories based on evidence from previous studies. For factors in each lifestyle category, the risk score ranged from 0 to 2 or from 0 to 3, depending on the exposure level and its health impact. The final risk level for each lifestyle category was classified as low, intermediate or high based on the total score. Details of each lifestyle category and their assessment can be found in online supplemental table S2, figure S1 and text S1.
Supplementary data
Lifestyle risk score
The LRS was calculated as the sum of all five categories (low, intermediate and high risk in each category are denoted by 0, 1 and 2, respectively), ranging from 0 to 10. A lower score indicated better adherence to an overall healthy lifestyle. Participants were categorised into three groups according to the LRS: low (0–3), intermediate (4–6) and high risk (7–10). To objectively estimate lifestyle risk and avoid assigning subjective values to lifestyle components, we created separate weighted LRS for IS, ICH and MI, based on the beta coefficients for each lifestyle factor in the Cox model with adjustments for other covariates. The beta coefficients for each lifestyle stratum were used to replace the original stratum scores and then summed. The weighted LRS were divided into low, intermediate and high groups based on the distribution of the unweighted LRS (online supplemental figure S2).
Genetic risk score
We used PRSice-2 software to generate GRS following an additive model for IS, ICH and MI separately.17 For each individual, we calculated quantitative aggregate risk scores, defined as the sum of the number of risk alleles present at each locus, weighted by the log of the OR for that locus estimated from the summary statistics data. The GRS was z-standardised for all individuals and then classified as low, moderate or high risk by tertile. Owing to the low incidence in ICH, we categorised these participants into low and high genetic risk, using median values of Polygenic Risk Score (PRS) as the cut-off to ensure statistical power. Details on genotyping, imputation, quality control and calculation of GRS can be found in online supplemental text S2 and S3.
Assessment of outcomes
The outcome status of each participant was identified chiefly by linking to hospital admission data and death registry records. We defined the incident diseases according to the International Classification of Diseases 10th edition (ICD-10) and self-reported codes (online supplemental table S3). The duration of follow-up was calculated as the time between the baseline date and the first diagnosis of disease outcome, death, loss to follow-up or the end of follow-up on 30 November 2021, whichever occurred first. For participants with both hospital diagnoses and self-reported times, we took the earlier one as diagnosis time.
Statistical analyses
Incidence rates and 95% CIs per 100 000 person-years of outcomes in the study period were estimated by an exact Poisson test and stratified by genetic and lifestyle risk. Multivariable Cox regression models were used to estimate the association of each composite lifestyle category, LRS and GRS, individually and in combination, with outcomes. HRs with 95% CIs were used to quantify the effect estimates. For the model excluding GRS, the following were used as covariates: age, sex, BMI, Townsend deprivation index, qualification, low-density lipoprotein cholesterol, high-density lipoprotein cholesterol, history of CVD, history of hypertension, history of diabetes and history of cancer. Details of the covariates can be found in online supplemental text S4. For the model including GRS, the first 10 principal components of ancestry and genotyping batch were additionally adjusted. If covariate information was missing (<20%), we used multiple imputations based on five replications and a chained equation method in the R multivariate imputation by chained equation procedure to account for missing data.18 We performed a linear trend test by entering the median value of each risk group as a continuous variable in the model.
We stratified the analyses between the LRS and GRS, individually and in combination, and risk of incident events by age (<60 years and ≥60 years), sex (male and female), BMI (<30 kg/m2 and ≥30 kg/m2) and pre-existing cardiometabolic diseases (CMD) (yes and no). CMD included hypertension, CVD and/or type 2 diabetes (ICD-10 codes E111). The multiplicative interaction was tested using the likelihood ratio test by including an additional product term in the fully adjusted model. The presence of an additive interaction was determined by calculating the relative excess risk due to interaction (RERI), the attributable proportion (AP) and the synergy index (SI). The Schoenfeld residual method was used to test the proportional hazards assumption of the Cox model, and no violations of the assumption were discovered.
The association between each composite lifestyle, lifestyle risk and outcomes was stratified by genetic risk. The 14-year (longest follow-up time) event rates were calculated using Cox regression and standardised to the average of all variables. We calculated the population attributable fraction (PAF),19 which is an estimate of the proportion of preventable events if all individuals were in the low LRS, low GRS category or any of the low-risk lifestyles.
Sensitivity analyses were conducted to evaluate the robustness of our findings. First, to reduce the possibility of spurious associations due to reverse causation, the associations of GRS and LRS with outcomes were reanalysed after excluding individuals who died or developed morbidity within the first 2 years of follow-up. Second, we assessed the competing risk of non-event death based on the association of combined LRS and GRS and all diseases of interest using the subdistribution method, with the competing event being death from all causes other than developing primary outcomes.
All analyses were performed using R (V.4.1.3). We set the α at 0.05 and used Bonferroni correction to adjust for multiple testing. We considered two-sided p values less than 0.017 divided by the number of tests, that is, 0.05/3, statistically significant.
Results
Participant characteristics
Of the study participants (n=3 15 044), 141 620 (45.0%) were males, and the mean (SD) age was 56.3 (8) years. Over a median of 12.8 years of follow-up, there were 4642 cases of incident IS, 1046 of incident ICH and 9485 of incident MI (table 1 and online supplemental table S5). In general, individuals with incident events of interest were more likely to be male, older, less likely to have a university degree and have an unhealthy lifestyle. The proportion of participants in each LRS group for different disease outcomes is detailed in online supplemental table S6.
Baseline characteristics of study participants
Associations of lifestyle risk and genetic risk
High-risk levels in most lifestyle categories were associated with a higher risk of IS, ICH and MI (figure 2). When these five individual lifestyle factors were considered jointly by using a weighted LRS (online supplemental figure S3), the incidence rates and risks of IS, ICH and MI increased significantly with increasing LRS (online supplemental table S7, all p for trend <0.001, figure 3). The multivariate-adjusted HRs (95% CI) for those with high LRS compared with those with low LRS were 2.78 (95% CI 2.40 to 3.21), 2.10 (95% CI 1.45 to 3.02) and 2.74 (95% CI 2.48 to 2.96) for IS, ICH and MI, respectively (figure 3).

Associations between each lifestyle and the risk of IS, ICH and MI. Cox regression models were additionally adjusted for age, sex, body mass index, Townsend deprivation index, qualification, high-density lipoprotein cholesterol, low-density lipoprotein cholesterol, history of cardiovascular disease, history of hypertension, history of diabetes and history of cancer. The green vertical dashed line represents the reference line, the green squares represent the HRs, and the green solid line represents the 95% CIs. The figure shows that high-risk levels in most lifestyle categories were associated with a higher risk of IS, ICH and MI. IS, ischaemic stroke; ICH, intracerebral haemorrhage; MI, myocardial infarction.

Standardised health event rates according to genetic and lifestyle risks. The left-hand panel, including A1, B1 and C1, shows the standardised event rates of IS, ICH and MI according to the genetic risk. The right-hand panel, including A2, B2 and C2, shows the standardised event rates of IS, ICH and MI according to lifestyle risk. Cox regression models, including lifestyle risk score, were adjusted for age, sex, body mass index, qualification, high-density lipoprotein cholesterol, low-density lipoprotein cholesterol, history of cardiovascular disease, history of hypertension, history of diabetes and history of cancer. Models, including genetic risk scores were adjusted for age, sex, the first 10 principal components of ancestry and genotyping batch. The 95% CIs for the HRs are provided in parentheses. The covariates were corrected by covariate mean substitution. IS, ischaemic stroke; ICH, intracerebral haemorrhage; MI, myocardial infarction.
Consistent results were observed in stratification by subgroups (online supplemental tables S8 and S9, all p for trend<0.001). In particular, these associations for IS were stronger among those aged <60 years (for high LRS: HR 3.07 (95% CI 2.45 to 3.84), p for interaction=0.010), and for MI, it was stronger among females (for high LRS: HR 3.35 (95% CI 2.88 to 3.91), p for interaction=0.001), those aged <60 years (for high LRS: HR 3.23 (95% CI 2.81 to 3.72), p for interaction<0.001) and those with BMI <30 (for high LRS: HR 2.91 (95% CI 2.58 to 3.28), p for interaction<0.001).
GRS showed the strongest association with IS at p<8.25e−6 (75 single-nucleotide polymorphisms (SNPs), online supplemental table S10), with ICH at p<2.10e−3 (1364 SNPs, online supplemental table S11) and with MI at p<7.90e−6 (105 SNPs, online supplemental table S12) and were therefore selected for subsequent analyses, with distributions approximating normal (online supplemental figure S4). Online supplemental table S6 and figure 3 showed that the risk of IS, ICH and MI also increased monotonically across GRS categories (all p for trend<0.010). Participants with a high GRS were associated with a higher risk of incident IS (HR 1.31 (95% CI 1.22 to 1.41)), incident ICH (HR 1.16 (95% CI 1.03 to 1.32)) and incident MI (HR 1.84 (95% CI 1.74 to 1.93)). The association of LRS or GRS with incident events was essentially unchanged after adjustment for each other. Results were consistent in subgroups, although the heterogeneity was not significant for ICH in the majority of subgroups (online supplemental tables S8 and S9). The association of GRS with MI was modified by age, with high GRS associated with significantly more MI events among those aged <60 years (p for interaction<0.001).
The joint effect of genetic and lifestyle risk
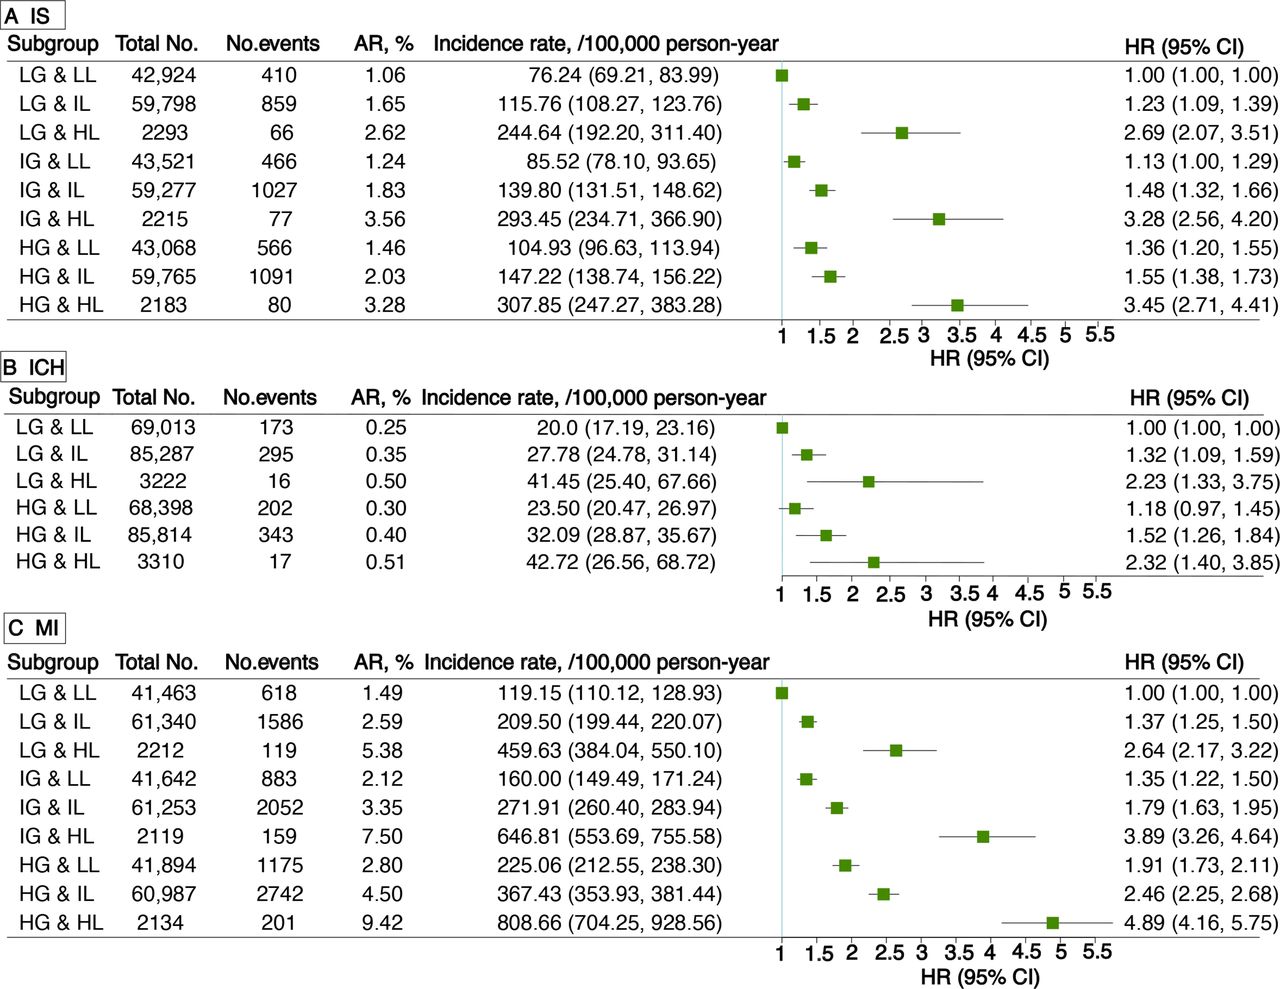
The effects of genetics and lifestyle on the risk of IS, ICH and MI were likely to be synergistic, with an overall monotonic association (figure 4). In particular, compared with participants with both low GRS and LRS, the HRs of those with both high GRS and LRS were 3.45 (95% CI 2.71 to 4.41), 2.32 (95% CI 1.40 to 3.85) and 4.89 (95% CI 4.16 to 5.75) for IS, ICH and MI, respectively. In addition, high LRS and high GRS showed a tendency to synergise across the three disease outcomes (RERI >0), and it was especially in MI that they had a significant additive interaction (RERI: 1.50, 95% CI 0.59 to 2.42; AP: 0.28, 95% CI 0.14 to 0.43; SI: 1.54, 95% CI 1.19 to 2.00) (online supplemental tables 13–15). Sensitivity and subgroup analyses showed similar results (online supplemental tables S16–S18), although in a few subgroups of patients with ICH with small sample sizes, this trend was not significant. Regarding IS, these associations were stronger among those aged <60 years (p for interaction=0.004). For MI, these associations were stronger among those aged <60 years (p for interaction<0.001) and those with a BMI <30 (p for interaction=0.008).

Risk of incident events associated with joint lifestyle and genetic risk. Cox regression models were adjusted for age, sex, body mass index, qualification, high-density lipoprotein cholesterol, low-density lipoprotein cholesterol, history of cardiovascular disease, history of hypertension, history of diabetes, history of cancer, the first 10 principal components of ancestry and genotyping batch. The green vertical solid line represents the reference line, the green squares represent HRs, and the green solid line represents 95% CIs. AR, absolute risk; HG, high genetic risk; HL, high lifestyle risk; ICH, intracerebral haemorrhage; IG, intermediate genetic risk; IL, intermediate lifestyle risk; IS, ischaemic stroke; LG, low genetic risk; LL, low lifestyle risk; MI, myocardial infarction.
Stratified analysis by genetic risk for association with lifestyle risk
High LRS was associated with a higher risk of disease in each genetic risk category (online supplemental table S19). Among participants with high GRS, a high LRS compared with a low LRS was associated with a 153% greater relative risk for IS, 96% for ICH and 157% for MI.
Similar trends were observed across individual lifestyle categories, regardless of genetic risk (figure 5 and online supplemental tables S20–S22). Moreover, in participants with high GRS, standardised 14-year rates of IS events were 4.40% (95% CI 3.45% to 5.36%) among those with high LRS. In contrast, these were only 1.78% (95% CI 1.63% to 1.94%) in those with low LRS. Similarly, for MI, the group with high LRS had standardised rates of 8.60% (95% CI 7.38% to 9.81%), as opposed to 3.34% (95% CI 3.12% to 3.56%) in the low LRS group. Among the group with high GRS of ICH, the rate of low LRS was about half that of high LRS, although the rate was low: 0.36% (95% CI 0.31% to 0.42%) and 0.71% (95% CI 0.36% to 1.05%), respectively (figure 6). Notably, participants with high LRS at a low GRS profile had a higher standardised cumulative event rate than those with low LRS at a high GRS profile (3.51% vs 1.78% for IS, 0.69% vs 0.36% for ICH and 5.63% vs 3.34% for MI).

Association of each lifestyle with incident IS, ICH and MI in genetic risk strata. Cox regression models were additionally adjusted for age, sex, body mass index, qualification, high-density lipoprotein cholesterol, low-density lipoprotein cholesterol, history of cardiovascular disease, history of hypertension, history of diabetes and history of cancer. *p<0.500; **p<0.010 and ***p<0.001. AR, absolute risk; HG, high genetic risk; HL, high lifestyle risk; ICH, intracerebral haemorrhage; IG, intermediate genetic risk; IL, intermediate lifestyle risk; IS, ischaemic stroke; LG, low genetic risk; LL, low lifestyle risk; MI, myocardial infarction.

Standardised 14-year outcome event rates, according to lifestyle and genetic risk. Shown are standardised 14-year cumulative incidence rates for IS, ICH and MI, according to lifestyle and genetic risks. A healthy lifestyle substantially reduced the risk of IS, ICH and MI and attenuated the genetic risk of those diseases by nearly 60%, 50% and 60%, respectively. Standardisation was performed on averages for each covariate. The I bars represent 95% CIs. The covariates were corrected by covariate mean substitution.
Population-attributable fraction
PAFs for lifestyle and genetics were calculated separately. In the data from this study, lifestyle risk contributed more to IS and ICH risk than genetic risk, whereas the opposite was true for MI, with genetic risk contributing slightly more than lifestyle (online supplemental figure S5). As shown in online supplemental table S23, adherence to different categories of low-risk lifestyles can prevent new-onset outcomes to varying degrees. Furthermore, for IS, 20.1% (95% CI 16.6% to 23.6%) of new-onset events during follow-up might have been prevented if all individuals had low LRS, 17.3% (95% CI 10.4% to 24.2%) for ICH and 23.4% (95% CI 21.1% to 25.7%) for MI.
Discussion
In this large prospective cohort study, we found that (1) lifestyle and genetic risks were independently and synergistically associated with the risk of IS, ICH and MI, and individuals whose genetic and lifestyle risks were both high had the greatest risk; (2) adherence to any of the ideal lifestyles or any positive change has been associated with varying degrees of reduction in the genetic risk of IS, ICH and MI, producing substantial benefits in individuals or populations and (3) when overall lifestyle risk is low, it is associated with a nearly 60%, 50% and 60% offset in the genetic risk of IS, ICH and MI, respectively.
Previous studies have also shown that an unhealthy lifestyle is associated with the risk of CVD,15 20 especially in young adults.21 In the current study, we constructed a weighted LRS using five composite lifestyle indicators and found that high lifestyle risk was associated with an increased risk of around 178% for IS, 110% for ICH and 174% for MI. Our stratified analyses found that these associations were particularly strong in those under 60 years. Besides the traditional healthy lifestyle factors, we also considered secondhand smoke exposure, alcohol consumption, sedentary behaviour and sleep patterns in the LRS. A previous study confirmed that even low doses of tobacco smoke increase the risk of stroke and MI.22 Harmful effects are further supported by studies of secondhand smoke.23 The biological effects of alcohol have been well-demonstrated: moderate and high alcohol intakes are associated with increased heart rate, electromechanical delay and impaired fibrinolysis.24–26 Furthermore, physical inactivity and sedentary behaviour are connected with an increased risk of cardiovascular disorders.9 27 High levels of physical activity can attenuate but not eliminate the increased risk associated with sedentary activity,28 and the impact of both on disease needs to be assessed holistically. In addition, healthy sleep patterns composed of five sleep behaviours significantly reduce the risk of coronary heart disease and stroke.8 The potential causal relationship between increased nap frequency and IS is also supported by Mendelian randomisation and prospective observations, suggesting that certain sleep behaviours may lead to compensatory changes in other sleep behaviours.29
Our findings further validate the risk of stroke and MI associated with these suboptimal lifestyles. These are consistent with previous studies showing that a broader and more detailed assessment of lifestyle can more accurately identify people at risk of unhealthy lifestyles. The low acceptability of healthy behaviours may be due to the highly individual nature of the decision to adopt healthy lifestyle behaviours and the misconception created by the traditional one-size-fits-all approach that health benefits only occur when predefined health indicators are met. However, our study suggests that all health behaviour improvements, regardless of size, deserve to be recognised. Moreover, age plays a significant role in the association between lifestyle and the risk of stroke and MI, particularly before the age of 60 years. Therefore, identifying unhealthy lifestyles in young and middle-aged populations and actively intervening are especially important to improve CVD health at the population level.
Stroke and MI are both complex diseases. Previous studies have shown that GRS constructed using multiple variant loci were effective predictors.30 31 In the present study, we calculated weighted GRS for each outcome and found that high genetic risk was associated with a 31% increased risk of IS, a 16% increased risk of ICH and an 84% increased risk of MI. In stratified analyses, we found a stronger association between genetic risk and the risk of MI in participants younger than 60, which is consistent with a study of twins in which early-onset MI had a stronger genetic component than late-onset MI.32
We also confirmed that genetics and lifestyle may play a synergistic role in the development of stroke and MI. Individuals whose genetic and lifestyle risks are both high have the greatest risk. This is because the biological effects of each factor are multivariate in nature, which may involve overlapping effects through pathways associated with stroke or MI.33 34 Furthermore, our results showed that adherence to any healthy lifestyle, even small choices, was associated with a reduction in the risk of stroke, and MI to varying degrees, independent of genetic risk. We can personalise the selection of intervention factors according to genetic risk for different disease outcomes at the individual level. At the population level, interventions can be prioritised for factors with a large attributable risk. The offsetting effect is greatest when the individual as a whole is at a low lifestyle risk. Compared with previous studies,20 35 we found that adherence to a low-risk lifestyle was associated with reducing the risk of IS, ICH and MI associated with genetic factors by at least half, respectively, suggesting that other healthy lifestyles should be given equal importance. In addition, individuals with a low genetic risk could lose their inherent protection if they adhere to an unhealthy lifestyle.
Strengths and limitations
The study has several strengths, including the large sample size, well-characterised phenotypes and prospective design. More importantly, we constructed weighted LRS and GRS separately for IS, ICH and MI.
Several limitations must be noted. First, potential changes in lifestyle factors following the baseline evaluation may have affected our risk estimations. Future studies need to investigate the effects of lifestyle changes over time. Second, in addition to the included lifestyle indicators, other potentially unknown factors may play a role in the development of stroke and MI. Third, since this is an observational study, the possibility of reverse causal associations remains, although participants were followed up for a median of 12.8 years. Fourth, the poor stratification of GRS for constructing ICH compared with IS and MI may be due to the relative rarity of the disease and the low statistical power of the available dataset. Fifth, some rare variants may not have been included based on the GWAS summary data. Finally, the majority of participants were of European descent. Our results might affect the generalisability of populations with alternative ancestry.
Conclusion
In summary, our findings suggest genetics and lifestyle jointly contribute to the risk of IS, ICH and MI. A healthy lifestyle is associated with a significantly reduced risk of stroke and MI, as well as attenuating the genetic risk of these diseases. This suggests that we need to focus on a broader level of healthy lifestyles and more particular disease subtypes. This allows us to consider individual characteristics effectively, that is, the priority lifestyle intervention factors can be adapted to the specific needs of individuals and genetic risk for disease subtypes. Our findings highlight the health benefits of shifting to a healthier lifestyle at any level.
Data availability statement
Data may be obtained from a third party and are not publicly available. The data that support the findings of this study are available from UK Biobank (https://www.ukbiobank.ac.uk/), but restrictions apply to the availability of these data, which were used under license for the current study, and so are not publicly available. Data are however available from the authors upon reasonable request and with permission of UK Biobank.
Ethics statements
Patient consent for publication
Ethics approval
This study involves human participants. The UK Biobank has ethics approval from the North West Multicentre Research Ethics Committee (11/NW/0382) and participants provided written informed consent. This research has been conducted using the UK Biobank Resource under the application number 92718. Participants gave informed consent to participate in the study before taking part.
Acknowledgments
We appreciate the work of the UK Biobank collaborators. This work was made possible by the generous sharing of GWAS summary statistics. We thank the MEGASTROKE consortium, the International Stroke Genetics Consortium, and the CARDIoGRAMplusC4D consortium. The MEGASTROKE project received funding from sources specified at http://www.megastroke.org/acknowledgments.html. Data on myocardial infarction have been contributed by CARDIoGRAMplusC4D investigators and have been downloaded from www.CARDIOGRAMPLUSC4D.ORG. Data on intracerebral haemorrhage have been downloaded from the ISGC Cerebrovascular Disease Knowledge Portal.
Footnotes
JW, ZL and CH contributed equally.
Contributors JW and YJ contributed to the study design. ZL and CH provided methodological support. JW managed and statistically analysed the data. JW, CH, RZ, DZ, YX and PZ developed the data visualisations. All authors contributed to data interpretation. XC, CS and YJ acquired funding and provided supervision. The manuscript was written by JW and YJ. MC, KX, GZ and LJ critically revised the manuscript. All authors revised the manuscript for important intellectual content, participated in the decision to submit the manuscript for publication and approved the final submitted version. JW, CS and YJ directly accessed and verified the underlying data reported in the manuscript and had final responsibility for the decision to submit for publication. All authors vouch for the completeness and accuracy of the data. YJ was the guarantor to this manuscript.
Funding This work was supported by the National Key Research and Development programme of China (grant number: 2021YFC2500100), Science and Technology Innovation 2030 Major Projects (grant number: 2022ZD0211600), Shanghai Rising-Star Programme (grant number: 22QA1404000), Shanghai Municipal Science and Technology Major Project (grant number: 2017SHZDZX01), Natural Science Foundation of Shanghai, China (grant number: 22ZR1405300), Key Research and Development Plans of Jiangsu Province, China (grant number: BE2021696), Shanghai New Three-year Action Plan for Public Health (Grant No. GWVI-11.1-23)
Competing interests None declared.
Provenance and peer review Not commissioned; externally peer reviewed.
Supplemental material This content has been supplied by the author(s). It has not been vetted by BMJ Publishing Group Limited (BMJ) and may not have been peer-reviewed. Any opinions or recommendations discussed are solely those of the author(s) and are not endorsed by BMJ. BMJ disclaims all liability and responsibility arising from any reliance placed on the content. Where the content includes any translated material, BMJ does not warrant the accuracy and reliability of the translations (including but not limited to local regulations, clinical guidelines, terminology, drug names and drug dosages), and is not responsible for any error and/or omissions arising from translation and adaptation or otherwise.
This is an open access article distributed in accordance with the Creative Commons Attribution Non Commercial (CC BY-NC 4.0) license, which permits others to distribute, remix, adapt, build upon this work non-commercially, and license their derivative works on different terms, provided the original work is properly cited, appropriate credit is given, any changes made indicated, and the use is non-commercial. See: http://creativecommons.org/licenses/by-nc/4.0/.
References


