

Article Figures & Data
Figures
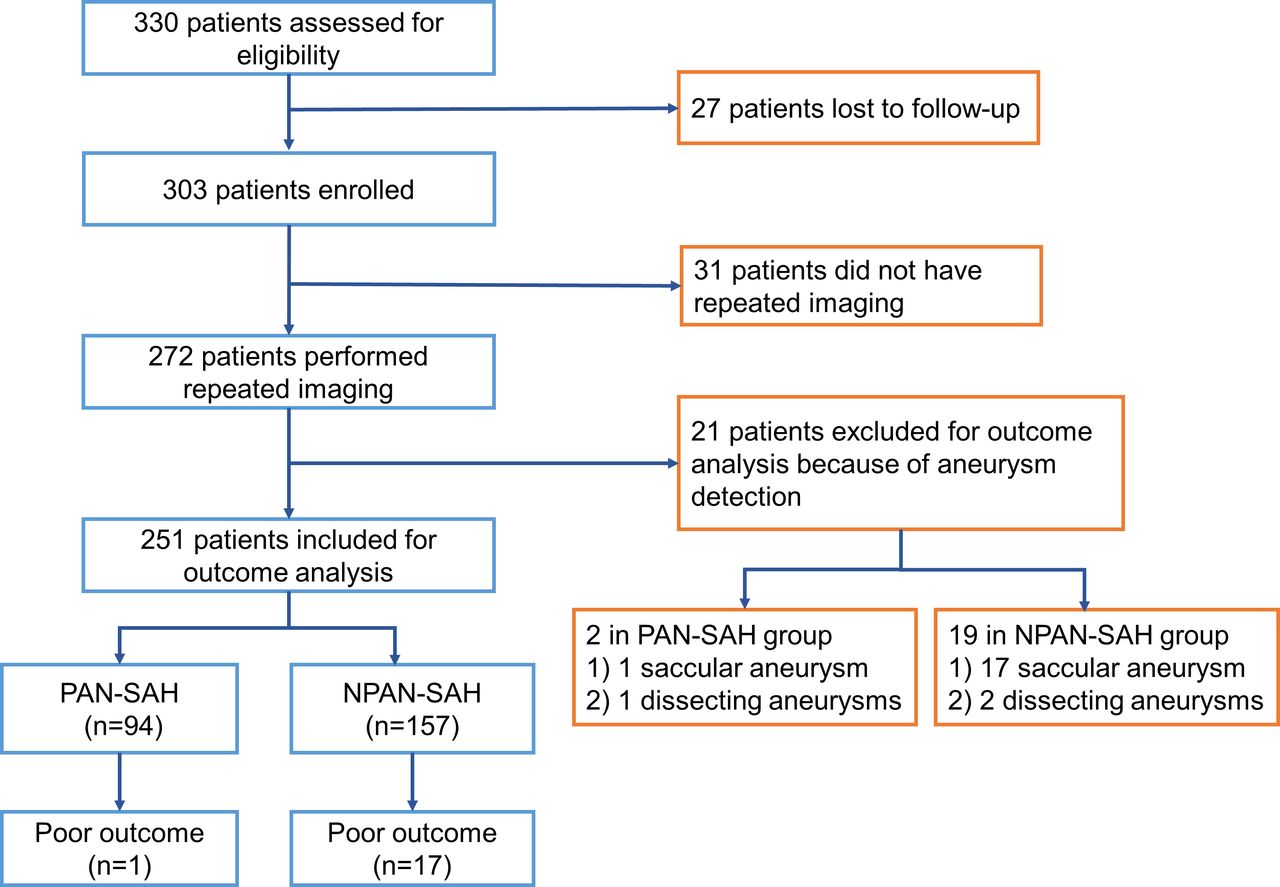
- Figure 1
The flow chart of the study patient. NPAN-SAH, non-perimesencephalic angiogram-negative SAH; PAN-SAH, perimesencephalic angiogram-negative subarachnoid haemorrhage.
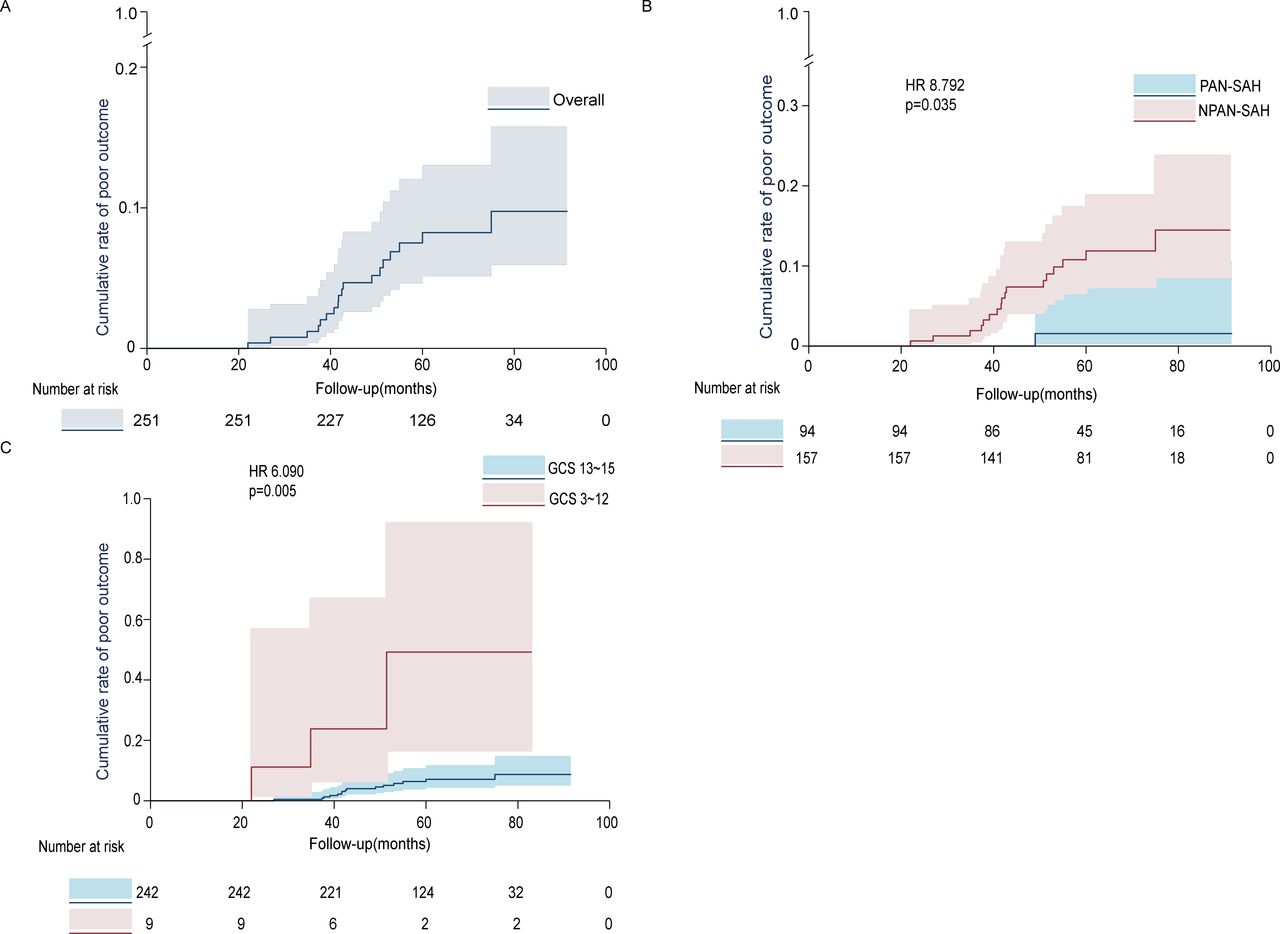
- Figure 2
Kaplan-Meier curves showing the poor outcome rates in different subgroups. (A) Kaplan-Meier curve analysis showing the overall poor outcome rates; (B) Kaplan-Meier curve analysis (log-rank test) showing the different cumulative poor outcome rates between NPAN-SAH and PAN-SAH; (C) Kaplan-Meier curve analysis (log-rank test) showing the different cumulative poor outcome rates between GCS 13–15 and GCS 3–12. NPAN-SAH, non-perimesencephalic angiogram-negative SAH; PAN-SAH, perimesencephalic angiogram-negative subarachnoid haemorrhage.


Tables
- Table 1
Baseline characteristics and hospitalisation complications of all anSAH patients
Variables Overall PAN-SAH NPAN-SAH P value (n=303) (n=110) (n=193) Age mean (years) 54.7±11.2 52.7±11.5 55.7±11.1 0.027†* >60 years, no (%) 104 (34.3) 24 (21.8) 80 (41.5) 0.001‡* Female, no (%) 159 (52.5) 59 (53.6) 100 (51.8) 0.760‡ Smoking history, no (%) 64 (21.1) 23 (20.9) 41 (21.2) 0.993‡ Medical history, no (%) Hypertension 118 (38.9) 35 (31.8) 83 (43.0) 0.055‡ Hyperlipidaemia 136 (44.9) 53 (48.2) 83 (43.0) 0.384‡ Diabetes mellitus 50 (16.5) 15 (13.6) 35 (18.1) 0.310‡ Coronary heart disease 22 (7.3) 7 (6.4) 15 (7.8) 0.650‡ Ischaemic cerebrovascular disease 18 (5.9) 5 (4.5) 13 (6.7) 0.410‡ Antithrombotic drugs, no (%) 19 (6.3) 8 (7.3) 11 (5.7) 0.587‡ HH grades 3–5 20 (6.6) 0 20 (10.4) <0.001‡* mFS 3–4 76 (25.1) 17 (15.0) 59 (30.6) 0.004‡* GCS 3–12 12 (4.0) 2 (1.8) 10 (5.2) 0.255‡ Complications Rebleed, no (%) 2 (0.7) 0 2 (1.0) 0.536§ Ictal infarction, no (%) 2 (0.7) 1 (0.9) 1 (0.5) 0.999§ Delayed cerebral infarction, no (%) 6 (2.0) 2 (1.8) 4 (2.1) 0.999§ Vasospasm, no (%) 6 (2.0) 1 (0.9) 5 (2.6) 0.423§ Hydrocephalus, no (%) 50 (16.5) 5 (4.5) 45 (23.3) <0.001‡* CSF drainage, no (%) 5 (1.7) 0 5 (2.6) 0.163§ Pulmonary infection, no (%) 20 (6.6) 1 (0.9) 19 (9.8) 0.001‡* Electrolyte imbalance, no (%) 171 (56.4) 45 (40.9) 126 (65.3) <0.001‡* Acute gastric ulcer, no (%) 19 (6.3) 2 (1.8) 17 (8.8) 0.016‡* Deep venous thrombosis, no (%) 14 (4.6) 6 (5.5) 8 (4.1) 0.602‡ Death, no (%) 3 (1.0) 0 3 (1.6) 0.556§ LOS mean (days) 12.9±5.8 12.0±5.0 13.4±6.2 0.041†* *p<0.05.
†T-test.
‡χ2 test.
§Fisher’s exact test.
anSAH, angiogram-negative subarachnoid haemorrhage; CSF, cerebrospinal fluid; GCS, Glasgow Coma Score; HH grade, Hunt-Hess grade; LOS, length of stay; mFS, modified Fisher Scale; NPAN-SAH, non-perimesencephalic angiogram-negative SAH; PAN-SAH, perimesencephalic angiogram-negative SAH.
- Table 2
Diagnosis of causative vascular lesions by repeated imaging in anSAH patients
Overall PAN-SAH NPAN-SAH P value (n=303) (n=110) (n=193) Repeated imaging, no (%) 272 (89.8) 96 (87.3) 176 (91.2) 0.279† CTA 242 (89.0) 85 (88.5) 157 (89.2) 0.868† DSA 120 (44.1) 41 (42.7) 79 (44.9) 0.525† MRA 9 (3.3) 6 (6.3) 3 (1.7) 0.085† Diagnosis, no (%) 21 (7.7) 2 (2.1) 19 (10.8) 0.010†* Saccular aneurysm 18 (6.6) 1 (1.0) 17 (9.7) Dissecting aneurysm 3 (1.1) 1 (1.0) 2 (1.1) *p<0.05.
†χ2 test.
anSAH, angiogram-negative subarachnoid haemorrhage; CTA, CT angiography; DSA, digital subtraction angiography; MRA, MR angiography; NPAN-SAH, non-perimesencephalic angiogram-negative SAH; PAN-SAH, perimesencephalic angiogram-negative SAH.
- Table 3
Logistic analyses of risk factors associated with detection of causative aneurysm by repeated imaging†
Variable n Univariate analysis Multivariate analysis OR (95% CI) P value OR (95% CI) P value NPAN-SAH 19 5.688 (1.296 to 24.968) 0.021* 4.682 (1.050 to 20.872) 0.043* Age >60 years 8 1.315 (0.524 to 3.330) 0.559 Female 11 0.945 (0.388 to 2.305) 0.901 Smoker 3 0.477 (0.136 to 1.672) 0.247 Hypertension 11 1.661 (0.680 to 4.056) 0.265 Hyperlipidaemia 10 0.581 (0.251 to 1.343) 0.987 Diabetes mellitus 4 1.279 (0.408 to 4.005) 0.673 Coronary heart disease 1 1.553 (0.184 to 13.075) 0.686 Ischaemic cerebrovascular disease 2 1.927 (0.405 to 9.174) 0.410 HH grades 1–2‡ 20 HH grades 3–5 1 0.688 (0.087 to 5.442) 0.723 mFS 1–2 ‡ 9 mFS 3–4 12 4.437 (1.781 to 11.053) 0.001* 3.790 (1.502 to 9.566) 0.005* GCS 13–15‡ 19 GCS 3–12 2 2.830 (0.570 to 14.044) 0.203 Hydrocephalus 5 1.601 (0.555 to 4.613) 0.384 *p<0.05.
†Thirty-one patients without repeated imaging were excluded for the logistic analysis.
‡Reference.
GCS, Glasgow Coma Score; HH grade, Hunt-Hess grade; mFS, modified Fisher Scale; n, number of events; NPAN-SAH, non-perimesencephalic angiogram-negative subarachnoid haemorrhage.
- Table 4
The incidence rate for aneurysm detection in different risk groups
Group Aneurysm detection n/N IR (95% CI) Low risk* 1/80 1.250 (0.176 to 8.874) intermediate risk* 9/138 6.522 (3.393 to 12.534) high risk* 11/54 20.370 (5.034 to 36.783) Overall 21/272 7.721 (5.034 to 11.841) *The patients were stratified into three groups according to the presence of two risk factors (NPAN-SAH and mFS 3–4): the low-risk group was without any of the two risk factors, the intermediate-risk group only had one risk factor, and the high-risk group had >1 risk factor.
IR, incidence rate; mFS, modified Rankin Scale; N, total number in the corresponding group; n, number of events; NPAN-SAH, non-perimesencephalic angiogram-negative subarachnoid haemorrhage.
- Table 5
Univariate and multivariate Cox analyses of risk factors associated with poor outcome†
Variable n Univariate analysis Multivariate analysis HR (95% CI) P value HR (95% CI) P value NPAN-SAH 17 9.931 (1.321 to 74.670) 0.026* 8.792 (1.162 to 66.528) 0.035* Age >60 years 9 0.855 (0.305 to 2.401) 0.767 Female 12 1.059 (0.418 to 2.684) 0.904 Smoker 3 1.211 (0.431 to 3.402) 0.716 Hypertension 9 0.809 (0.303 to 2.155) 0.671 Hyperlipidaemia 4 0.467 (0.166 to 1.311) 0.148 Diabetes mellitus 4 0.753 (0.173 to 3.276) 0.705 Coronary heart disease 3 2.028 (0.466 to 8.832) 0.346 Ischaemic cerebrovascular disease 2 2.994 (0.685 to 13.084) 0.145 Antithrombotic drugs 1 0.802 (0.107 to 6.033) 0.830 HH grades 1–2‡ 16 HH grades 3–5 2 2.879 (0.830 to 9.985) 0.096 mFS 1–2‡ 3 mFS 3–4 15 2.207 (0.823 to 5.917) 0.116 GCS 13–15‡ 14 GCS 3–12 4 8.218 (2.362 to 28.590) 0.001* 6.090 (1.744 to 21.258) 0.005* Hydrocephalus 2 2.229 (0.794 to 6.254) 0.128 Pulmonary infection 2 0.924 (0.123 to 6.947) 0.939 Deep venous thrombosis 1 3.258 (0.747 to 14.216) 0.116 *p<0.05.
†Thirty-one patients without repeated imaging and 21 patients with aneurysm detection were excluded for the Cox analysis.
‡Reference.
GCS, Glasgow Coma Score; HH grade, Hunt-Hess grade; mFS, modified Fisher Scale; n, number of events; NPAN-SAH, non-perimesencephalic angiogram-negative subarachnoid haemorrhage.
- Table 6
Annual and 5-year incidence rates of poor outcome in the different groups
Group n/N Annual IR (95% CI) Cumulative IR (95% CI) 5 years Low risk* 1/92 0.215 (0.030 to 1.527) 1.875 (0.264 to 13.310) Intermediate risk* 14/152 1.817 (1.076 to 3.067) 10.744 (4.630 to 27.573) High risk* 3/7 9.883 (3.187 to 30.643) 75.302 (10.607 to 534.573) Overall 18/251 1.422 (0.896 to 2.257) 8.431 (3.352 to 24.405) *The patients were stratified into three groups according to the presence of two risk factors (NPAN-SAH and GCS 3–12): the low-risk group is without any of the two risk factors, intermediate-risk group only has one risk factor, and high-risk group has >1 risk factor.
GCS, Glasgow Coma Score; IR, incidence rate; N, total number in the corresponding group; n, number of events; NPAN-SAH, non-perimesencephalic angiogram-negative subarachnoid haemorrhage.


