

Article Figures & Data
- Figure 1
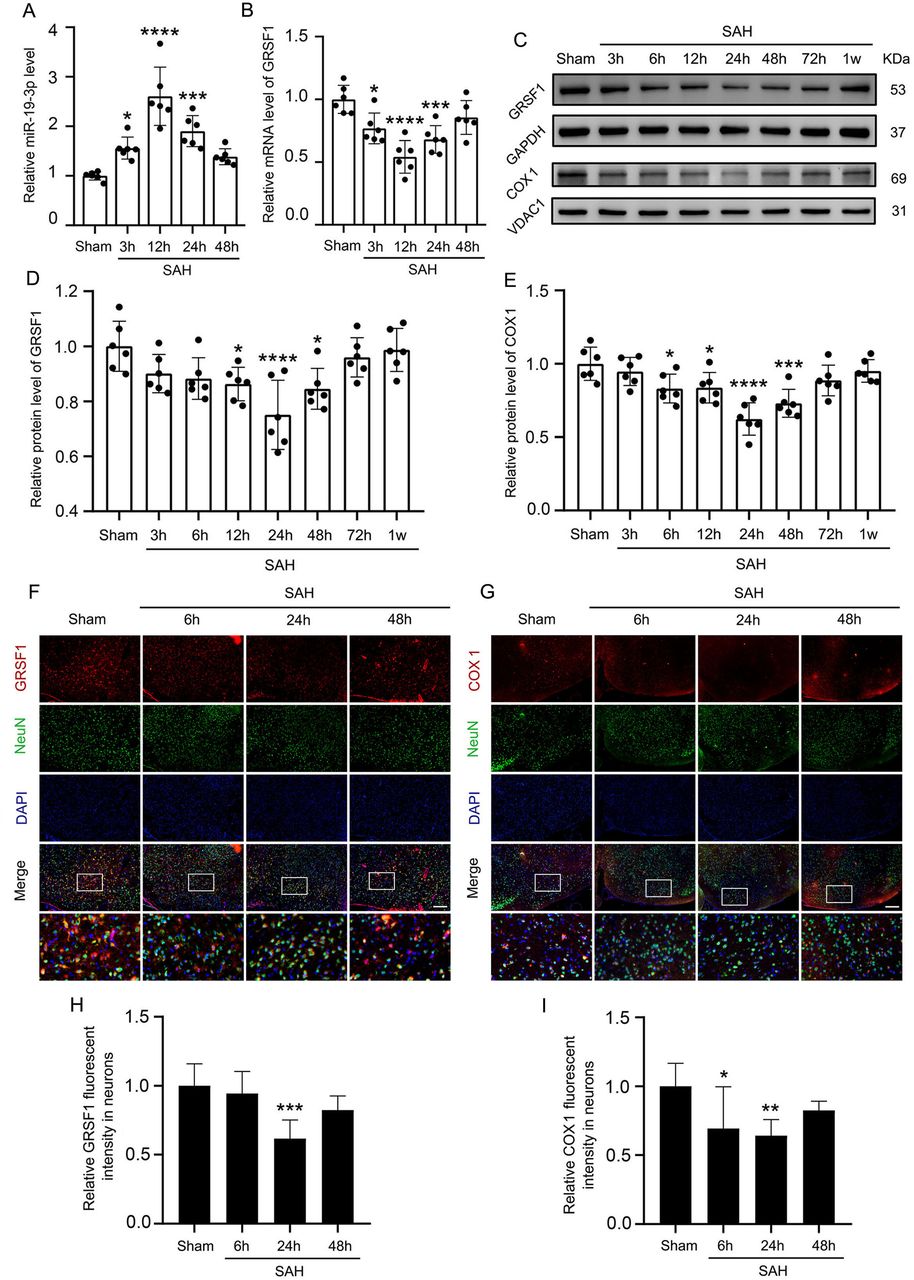
Levels of miR-19-3p, GRSF1 mRNA and protein, and COX1 protein, and expression of GRSF1 and COX1 in neurons following SAH. (A, B) Quantitative analysis of miR-19-3p and GRSF1 mRNA levels using the Sham group as a standard. (C) Western blot of GRSF1 and COX1 showed representative bands. (D, E) Quantitative analysis of GRSF1 and COX1 protein levels at different stages after SAH using the Sham group as a standard. (F, G) Double immunofluorescence was performed with GRSF1 and COX1 (red, Alexa Fluor 555) and the neuronal marker (NeuN; green, Alexa Fluor 488). Nuclei were stained with DAPI (blue). GRSF1 and COX1 were mainly located in the neurons. The immunopositivity of GRSF1 and COX1 was significantly decreased at 24 hours after SAH compared with the Sham group. Scale bars: 100 µm. (H, I) Quantitative analysis of GRSF1 and COX1 fluorescence intensity, which was normalised to Sham group. Data are shown as mean±SD (n=6). *p<0.05, **p<0.01, ***p<0.001, ****p<0.0001, vs Sham group (one-way analysis of variance followed by Scheffé’s post hoc test). COX1, cytochrome C oxidase 1; DAPI, 4′,6-diamidino-2-phenylindole; GAPDH, glyceraldehyde-3-phosphate dehydrogenase; GRSF1, guanine-rich RNA sequence binding factor 1; SAH, subarachnoid haemorrhage; VDAC1, voltage-dependent anion channel 1.
- Figure 2
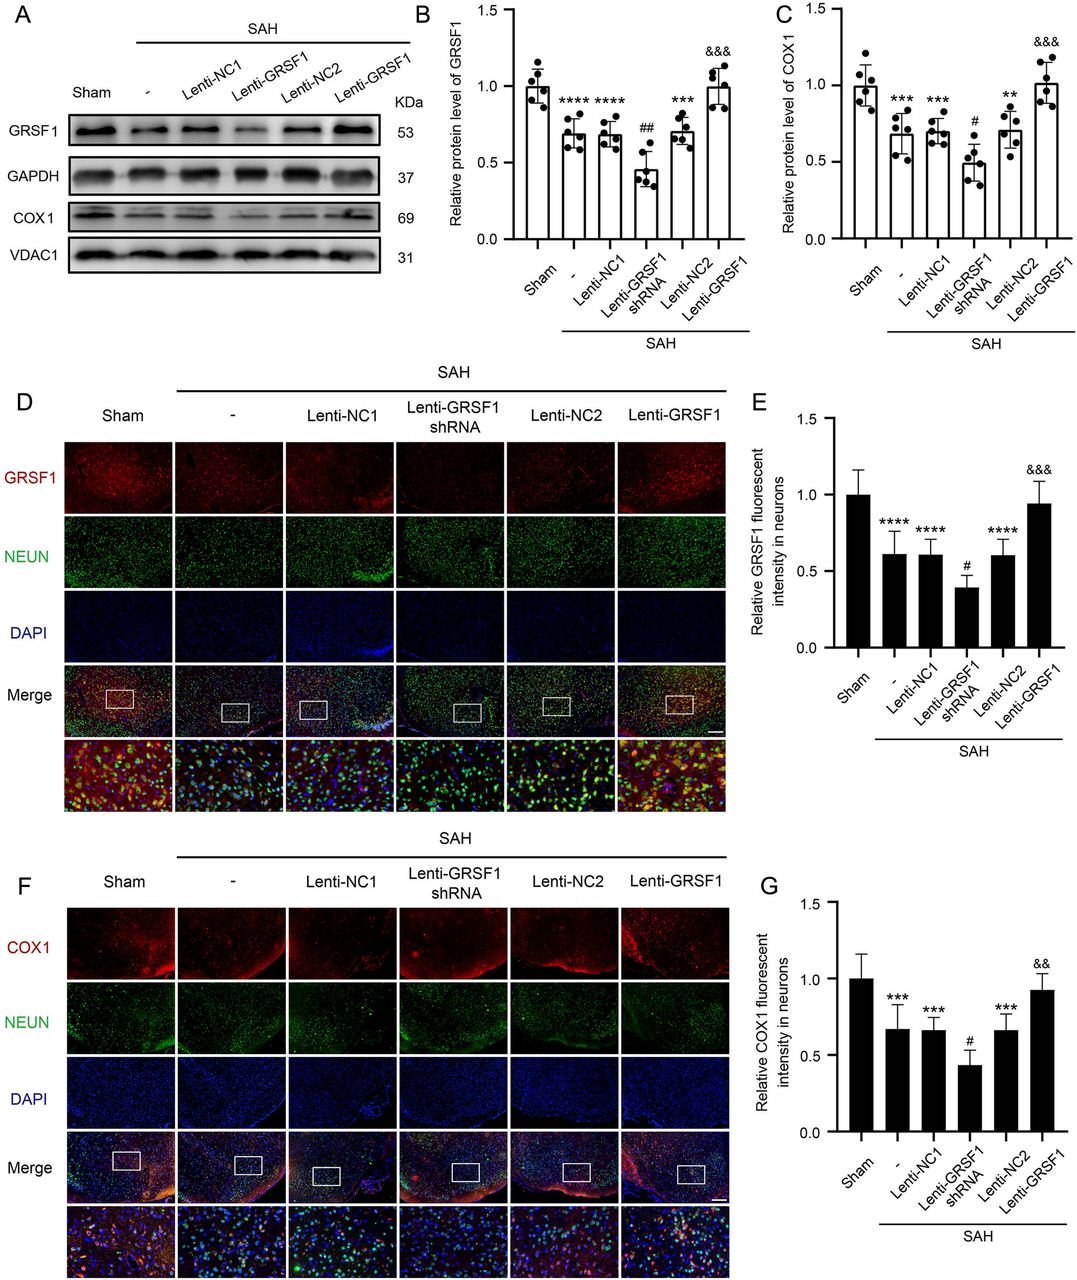
Protein expression levels of GRSF1 and COX1 under Lenti-GRSF1 shRNA and Lenti-GRSF1 treatments after in vivo SAH (A) Following in vivo SAH, western blots revealed GRSF1 and COX1 bands under Lenti-GRSF1 shRNA and Lenti-GRSF1 treatments. (B, C) Quantitative analysis of GRSF1 and COX1 protein levels following in vivo SAH with the Sham group as the standard. (D, F) Double immunofluorescent staining was performed with GRSF1 and COX1 (red, Alexa Fluor 555) and the neuronal marker (NeuN; green, Alexa Fluor 488); nuclei were stained with DAPI (blue). Silencing GRSF1 decreased the neuronal expression of GRSF1 and COX1. Conversely, overexpressing GRSF1 increased the neuronal GRSF1 and COX1 expression. Scale bars: 200 µm. (E, G) Comparative analysis of the expression of GRSF1 and COX1 in different groups using quantitative fluorescent intensity analysis with the Sham group as the standard. Data are shown as the mean±SD (n=6). **p<0.01, ***p<0.001, ****p<0.0001 vs Sham group; #p<0.05, ##p<0.01 vs Lenti-NC1 group; &&p<0.01, &&&p<0.001 vs Lenti-NC2 group (one-way analysis of variance followed by Scheffé’s post hoc test). COX1, cytochrome C oxidase 1; DAPI: 4′,6-diamidino-2-phenylindole; GRSF1, guanine-rich RNA sequence binding factor 1; OxyHb, oxyhemoglobin; SAH, subarachnoid haemorrhage; TUNEL, terminal deoxynucleotidyl transferase-mediated dUTP nick end labelling, VDAC1, voltage-dependent anion channel 1.
- Figure 3
Protein expression levels of GRSF1 and COX1 under miR-19-3p mimic and miR-19-3p inhibitor treatments after in vitro SAH. (A) Following in vitro SAH, GRSF1 and COX1 bands were detected by western blotting under mimicry or inhibitory treatments with miR-19-3p. (B, C) GRSF1 and COX1 quantitative analysis following in vitro SAH in different groups, with the control group as the standard. (D, F) Immunofluorescence of GRSF1 (red, Alexa Fluor 555) and COX1 (green, Alexa Fluor 555) in primary neurons, and nuclei were stained with DAPI (blue). miR-19-3p mimic decreased the neuronal GRSF1 and COX1 expression. Conversely, the miR-19-3p inhibitor increased the neuronal GRSF1 and COX1 expression. Scale bars: 200 µm. (E, G) Quantitative analysis of GRSF1 and COX1 fluorescent intensity, with the control group as the standard. Data are shown as the mean±SD (n=6). *p<0.05, **p<0.01 vs control group; #p<0.05, ##p<0.01 vs OxyHb group (one-way analysis of variance followed by Scheffé’s post hoc test). COX1, cytochrome C oxidase 1; DAPI, 4′,6-diamidino-2-phenylindole; GRSF1, guanine-rich RNA sequence binding factor 1; OxyHb, oxyhaemoglobin; SAH, subarachnoid haemorrhage.
- Figure 4
Protein expression levels of GRSF1 and COX1 under Lenti-GRSF1 shRNA and Lenti-GRSF1 treatments after in vivo SAH. (A) Following in vitro SAH, western blots showing GRSF1 and COX1 bands were detected under Lenti-GRSF1 shRNA and Lenti-GRSF1 treatments. (B, C) Quantitative analysis of GRSF1 and COX1 protein expression levels, with the Control group as the standard. (D) Immunofluorescence of GRSF1 (red, Alexa Fluor 555); nuclei were stained with DAPI (blue). Silencing GRSF1 decreased the neuronal GRSF1 expression. Conversely, overexpressing GRSF1 increased the neuronal GRSF1 expression. (F) Double immunofluorescence analysis of COX1 (red, Alexa Fluor 555) and ATPB (mitochondrial marker, green, Alexa Fluor 488); nuclei were stained with DAPI (blue). Silencing GRSF1 decreased the neuronal COX1 expression. Conversely, overexpressing GRSF1 increased the neuronal COX1 expression. Scale bars: 100 µm. (E, G) Comparative analysis of the expression of GRSF1 and COX1 using quantitative fluorescent intensity analysis. The Control group was regarded as the standard. Data are shown as mean±SD (n=6). *p<0.05, **p<0.01 vs control group; #p<0.05, ##p<0.01 vs Lenti-NC1 group; &p<0.05, &&p<0.01, &&&p<0.001 vs Lenti-NC2 group (one-way analysis of variance followed by Scheffé’s post hoc test). ATPB, beta subunit of ATP synthase; COX1, cytochrome C oxidase 1; DAPI, 4′,6-diamidino-2-phenylindole; GRSF1, guanine-rich RNA sequence binding factor 1; SAH, subarachnoid haemorrhage.
- Figure 5
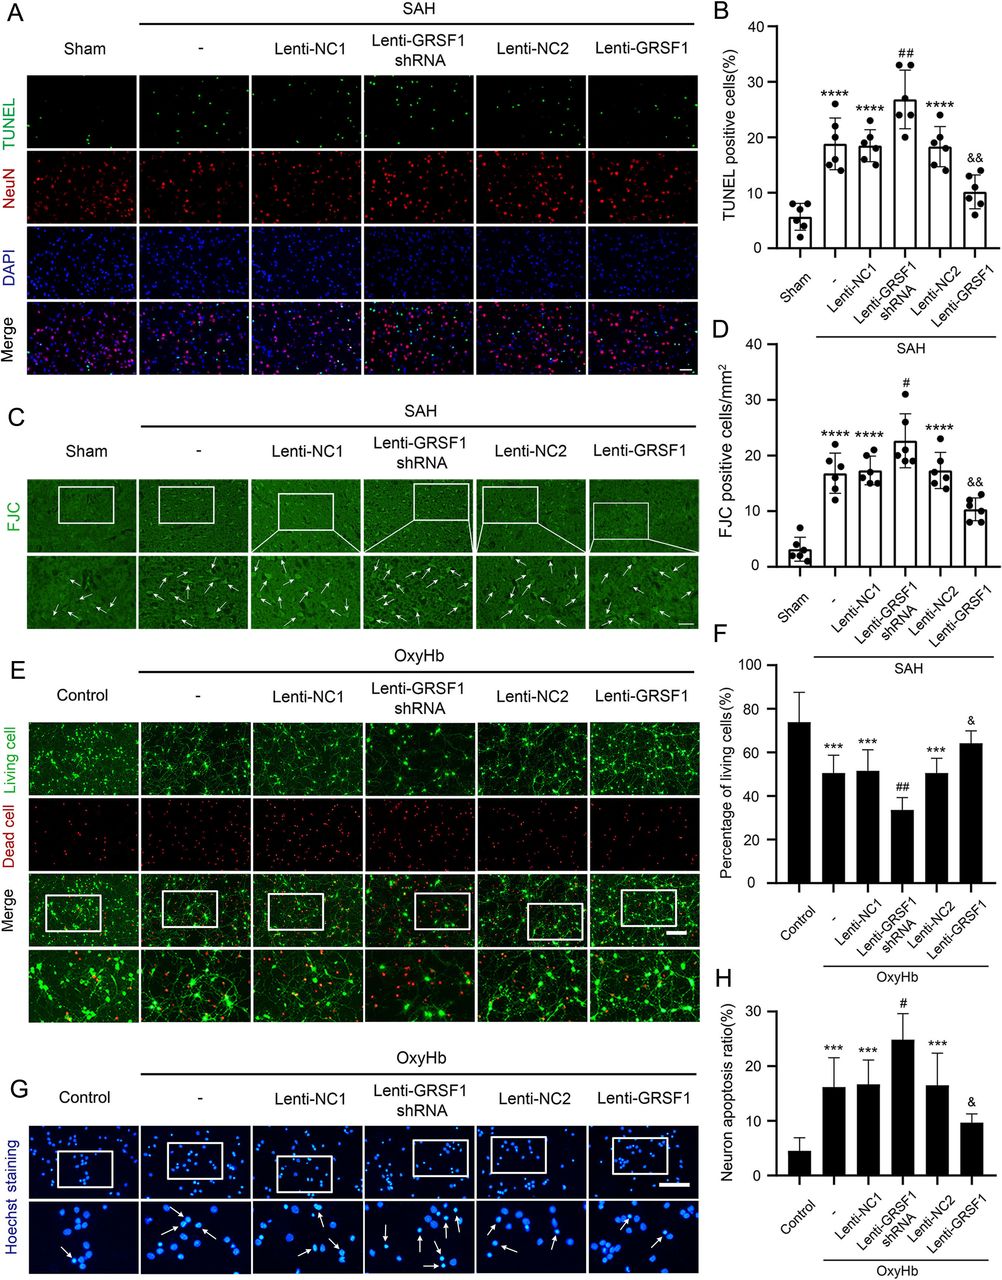
Effect of Lenti-GRSF1 shRNA and Lenti-GRSF1 on cortical cell apoptosis and degradation after SAH. (A) TUNEL staining (red, Alexa Fluor 555) and neuronal marker (NeuN, green, Alexa Fluor 488) were used to assess neuronal apoptosis. Silencing GRSF1 suppressed neuronal apoptosis and overexpressing GRSF1 aggravated neuronal apoptosis. Scale bar: 50 µm. (B) Quantitative analysis of the percentage of apoptotic neurons. (C) Neuronal degeneration was evaluated using FJC staining (green), with arrows pointing to cells that were positive for FJC. Silencing GRSF1 suppressed neuronal degeneration and overexpressing GRSF1 aggravated neuronal degeneration. Scale bar: 20 µm. (D) Number of FJC-positive cells/mm2. (E) Live-dead cellular staining: green staining indicates living neurons and red staining indicates dead neurons. Lenti-GRSF1 shRNA decreased and Lenti-GRSF1 improved the survival rates of oxyHb-induced damaged neurons. Scale bar: 100 µm. (F) Quantitative analysis of the percentage of living neurons in different groups. (G) Neuronal apoptosis was evaluated by Hoechst staining. Silencing GRSF1 aggravated neuronal cell apoptosis and overexpressing GRSF1 suppressed neuronal apoptosis. Scale bar: 150 µm. (H) Neuronal apoptosis ratio revealed by Hoechst staining. Data are shown as the mean±SD (n=6). ***p<0.001 vs control group; ****p<0.0001 vs sham group; #p<0.05, ##p<0.01 vs SAH+Lenti-NC1 group; #p<0.05, ##p<0.01 vs OxyHb+Lenti-NC1 group; &&p<0.01 vs SAH+Lenti-NC2 group; &p<0.05 vs OxyHb+Lenti-NC2 group; (one-way analysis of variance followed by Scheffé’s post hoc test). COX1, cytochrome C oxidase 1; DAPI, 4′,6-diamidino-2-phenylindole; FJC, Fluoro-Jade C; GRSF1, guanine-rich RNA sequence binding factor 1; OxyHb, oxyhaemoglobin; SAH: subarachnoid haemorrhage; TUNEL, terminal deoxynucleotidyl transferase-mediated dUTP nick end labelling.
- Figure 6
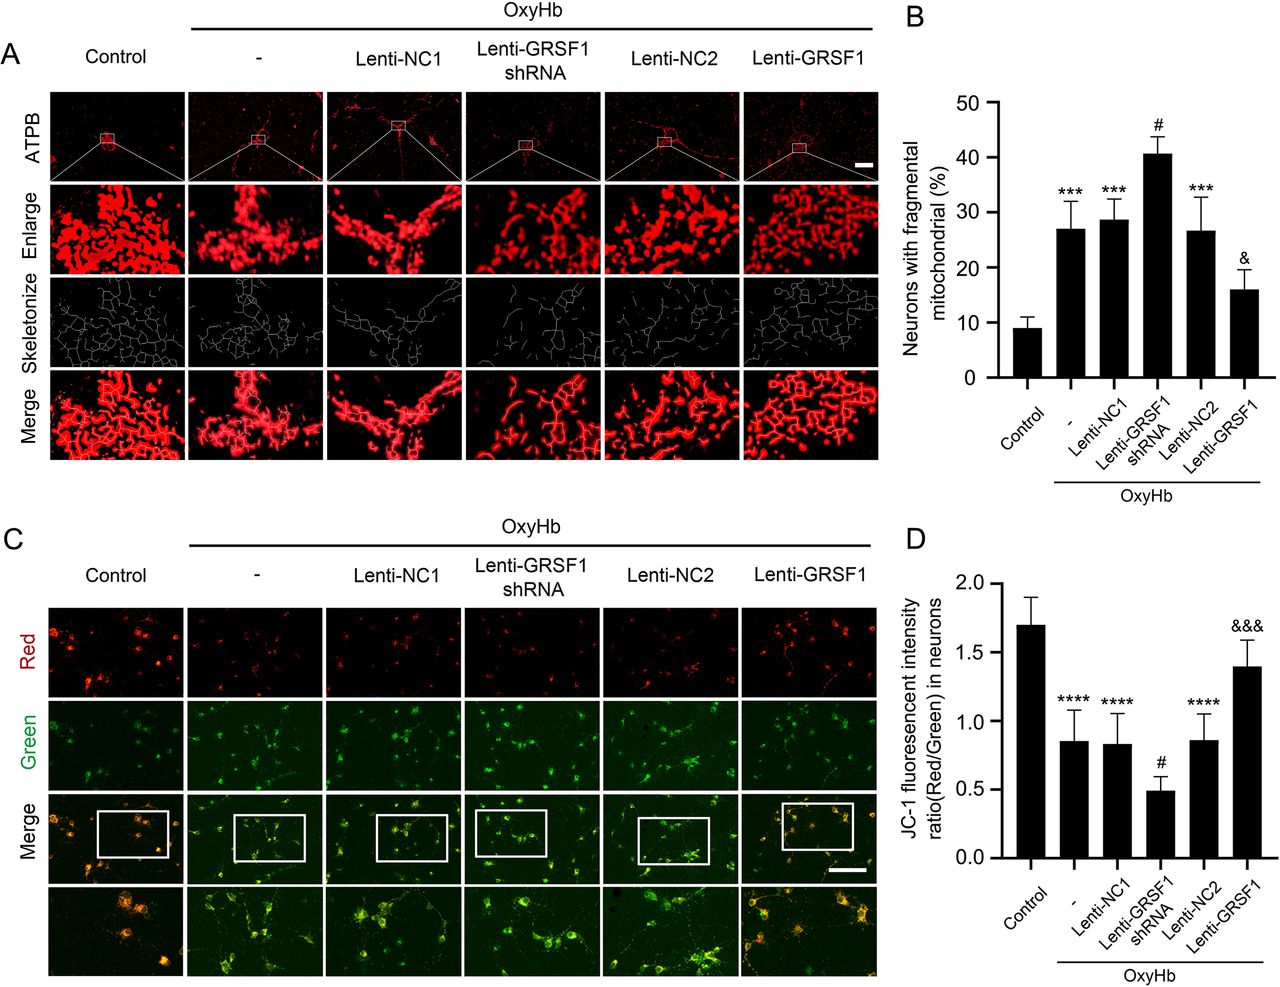
Effect of Lenti-GRSF1 shRNA and Lenti-GRSF1 treatments on mitochondrial damage under neuron injury conditions. (A) Immunofluorescence was performed with ATPB antibody (neuronal mitochondrial network, red, Alexa Fluor 555). Silencing GRSF1 aggravated mitochondrial damage while overexpressing GRSF1 relieved mitochondrial damage induced by oxyHb. Scale bars: 20 µm. (B) Quantitative analysis of the percentage of neurons with fragmented mitochondria. Silencing GRSF1 aggravated and overexpressing GRSF1 relieved the percentage of neurons with fragmented mitochondria induced by OxyHb. (C) Changes in mitochondrial membrane potential (ΔΨm). Silencing GRSF1 further reduced mitochondrial membrane potential and overexpressing GRSF1 enhanced OxyHb-induced mitochondrial membrane potential decline in neurons. The presence of red fluorescence represents a normal ΔΨm and a healthy cell state while green fluorescence indicates decreased ΔΨm and cells that are most likely in the early stages of apoptosis. Scale bar: 100 µm. (D) Quantitative analysis of JC-1 fluorescence intensity ratio (red/green) in neurons. Data are shown as the means±SD (n=3). ***p<0.001, ****p<0.0001 vs control group; #p<0.05vs OxyHb+Lenti-NC1 group; &p<0.05, &&&p<0.001 vs OxyHb+Lenti-NC2 group (one-way analysis of variance followed by Scheffé’s post hoc test). ATPB, beta subunit of ATP synthase; DAPI, 4′,6-diamidino-2-phenylindole; GRSF1, guanine-rich RNA sequence binding factor 1; OxyHb, oxyhaemoglobin; TUNEL, terminal deoxynucleotidyl transferase-mediated dUTP nick end labelling.
- Figure 7
Effect of Lenti-GRSF1 shRNA and Lenti-GRSF1 treatments on mitochondrial superoxide generation, mitochondrial bioenergetic deficits and mitochondrial apoptosis after in vitro SAH. (A) Representative fluorescent images of Mito-Sox staining (red) among different groups in in vitro SAH after 24 hours. Scale bars: 100 µm. (B) Quantitative analysis of mitochondrial superoxide in neurons. Silencing GRSF1 further enhanced and overexpressing GRSF1 reduced, OxyHb-induced superoxide generation in neurons. (C) Quantitative analysis of the ATP content in neurons. Silencing GRSF1 enhanced and overexpressing GRSF1 reduced, the ATP content in neurons after in vitro SAH. (D) Western blots showing representative caspase-9 and cleaved caspase-9 bands that were detected under Lenti-GRSF1 shRNA and Lenti-GRSF1 treatments. (E) Quantitative analysis of the ratio of cleaved caspase-9 to caspase-9 in neurons. Silencing GRSF1 enhanced and overexpressing GRSF1 reduced, OxyHb-induced mitochondrial apoptosis in neurons. Data are shown as the means±SD (n=6). (F) Representative transmission electron microscopy images of neuronal mitochondria. Mitochondria in the control group had dense cristae and an appropriate mitochondrial length, but mitochondrial oedema appeared, and the length was shortened following the addition of OxyHb. Silencing GRSF1 impaired mitochondrial cristae oedema while overexpressing GRSF1 alleviated it. Scale bar: 0.5 µm. (G) Quantitative analysis for the proportion of mitochondria with fine and dense cristae. (H) Quantitative analysis for the mitochondrial length from each group. (I) Western blot showing representative 4-HNE bands detected under Lenti-GRSF1 shRNA and Lenti-GRSF1 treatments. (J) Quantitative analysis of the 4-HNE protein expression level, with the sham group as the standard. (K) Quantitative analysis of the ATP content in brain tissue. Data are shown as the means±SD (n=6). ***p<0.001, ****p<0.0001 vs control group or sham group; #p<0.05, ##p<0.01, ###p<0.001 vs OxyHb+Lenti-NC1 group or SAH+Lenti-NC1 group; &p<0.05, &&p<0.01 vs OxyHb+Lenti-NC2 group or SAH+Lenti-NC2 group (one-way analysis of variance followed by Scheffé’s post hoc test). GRSF1, guanine-rich RNA sequence binding factor 1; 4-HNE, 4-hydroxynonenal; OxyHb, oxyhaemoglobin; SAH, subarachnoid haemorrhage.
- Figure 8
Effect of silenced/overexpressed GRSF1 on neurological scores, sensory and locomotor function recovery, and spatial and motor learning ability of rats after SAH (A) Neurological scoring. (B) Rotarod test. When GRSF1 was silenced, rats lost locomotor function after SAH. When GRSF1 was overexpressed, rats recovered locomotor function more quickly. (C) Adhesive removal test. Overexpressing GRSF1 after SAH accelerated sensory recovery while silencing GRSF1 delayed it. (D–I) The red line represents the rats’ swimming tracks. Silencing and overexpressing GRSF1 resulted in longer and shorter swimming trajectories, respectively. The green circle indicates where the target platform is placed. (J) Escape latency in the Morris water maze. Silencing and overexpressing GRSF1 increased and decreased the escape latency, respectively. (K) Swimming distance in the Morris water maze. Silencing and overexpressing GRSF1 increased and decreased the swimming distance, respectively. (L) Roles of the miR-19-3 p/GRSF1/COX1 axis in SAH-induced EBI. GRSF1 and COX1 are involved in maintaining the integrity of the mitochondrial respiratory chain under normal circumstances. GRSF1/COX1 protein levels were significantly reduced following SAH while miR-19-3p levels were increased. Furthermore, inhibition of the miR-19-3p/GRSF1/COX1 axis aggravated SAH-induced EBI. Hence, the miR-19-3p/GRSF1/COX1 axis may play a neuroprotective role after SAH by maintaining normal mitochondrial function. Data are shown as the mean±SD (n=8). ****p<0.0001 vs sham group; #p<0.05, ##p<0.01, ###p<0.001 vs Lenti-NC1 group; &p<0.05, &&p<0.01 vs Lenti-NC2 group (two-way analysis of variance followed by Scheffé’s post hoc test). COX1, Cytochrome C oxidase 1; EBI, early brain injury; GRSF1, guanine-rich RNA sequence binding factor 1; mtDNA, mitochondrial DNA; nDNA, nuclear DNA; SAH, subarachnoid haemorrhage.


Supplementary Materials
Supplementary data
Additional Files
Supplementary Data
This web only file has been produced by the BMJ Publishing Group from an electronic file supplied by the author(s) and has not been edited for content.


