

Article Figures & Data
Figures
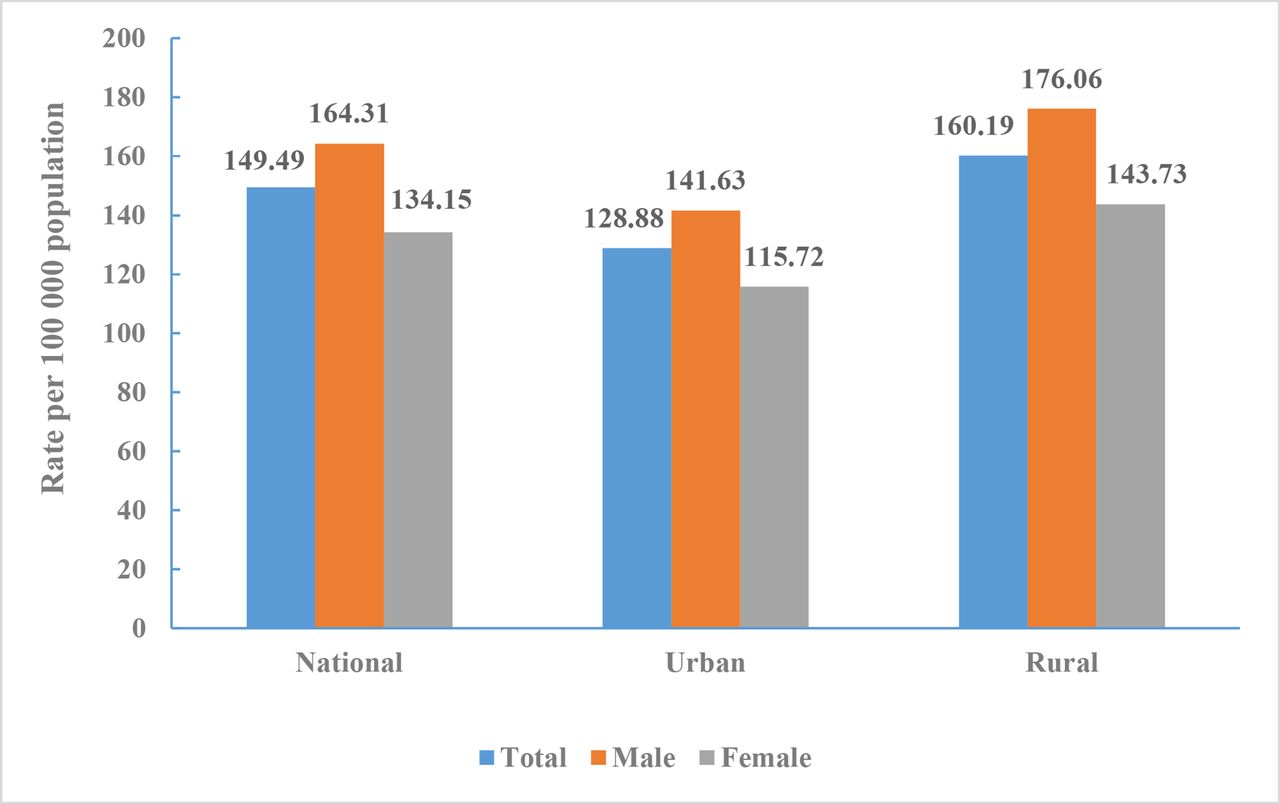
- Figure 1
Crude mortality rate of cerebrovascular disease in Chinese residents by sex and region, National Mortality Surveillance System 2018.
- Figure 2
Crude mortality rate of cerebrovascular disease in Chinese urban residents by age and sex, National Mortality Surveillance System 2018.
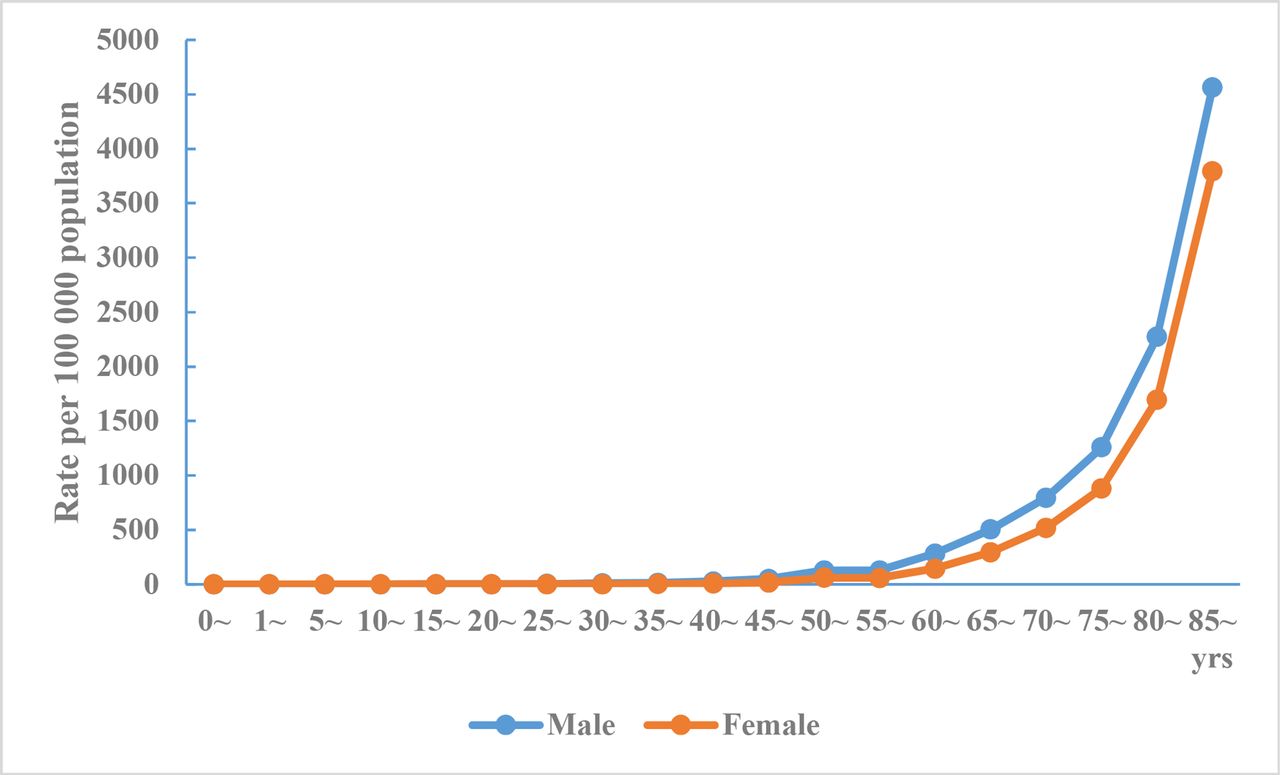
- Figure 3
Crude mortality rate of cerebrovascular disease in Chinese rural residents by age and sex, National Mortality Surveillance System 2018.
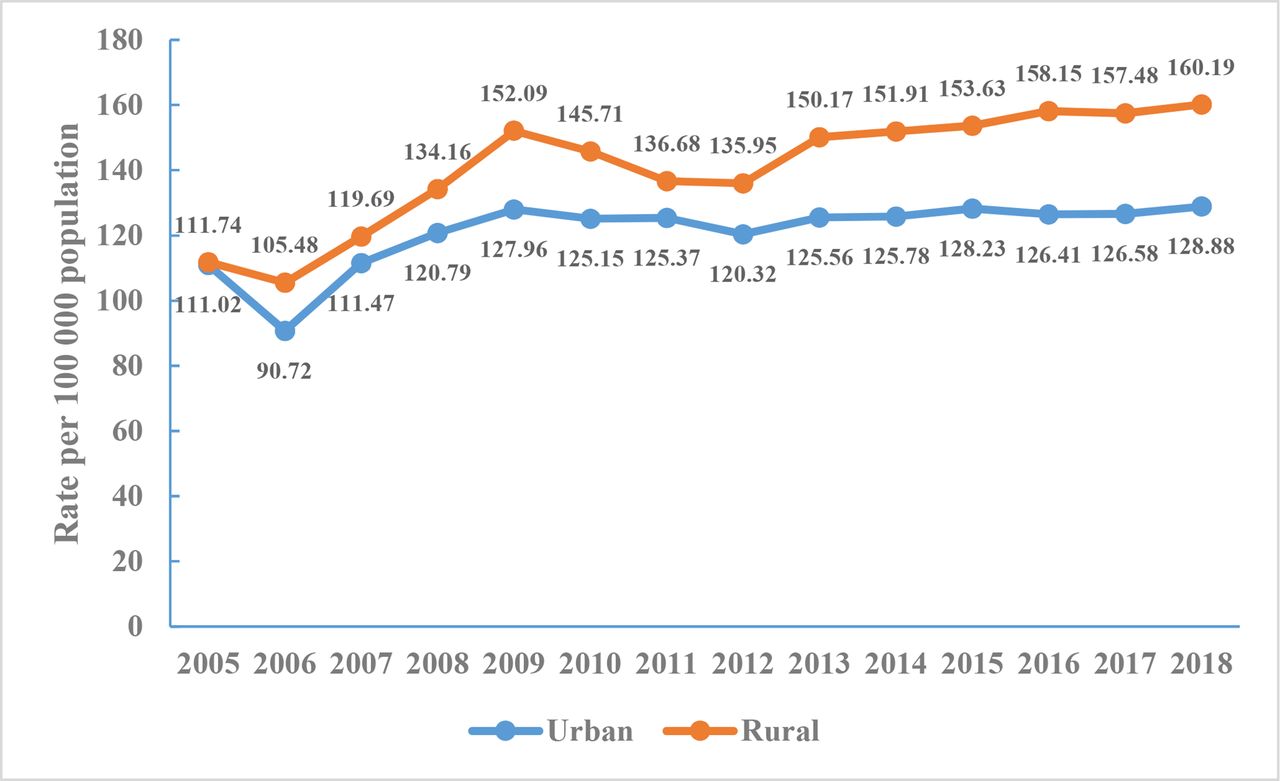
- Figure 4
Crude mortality rate of cerebrovascular disease in Chinese residents, National Mortality Surveillance System 2005–2018.
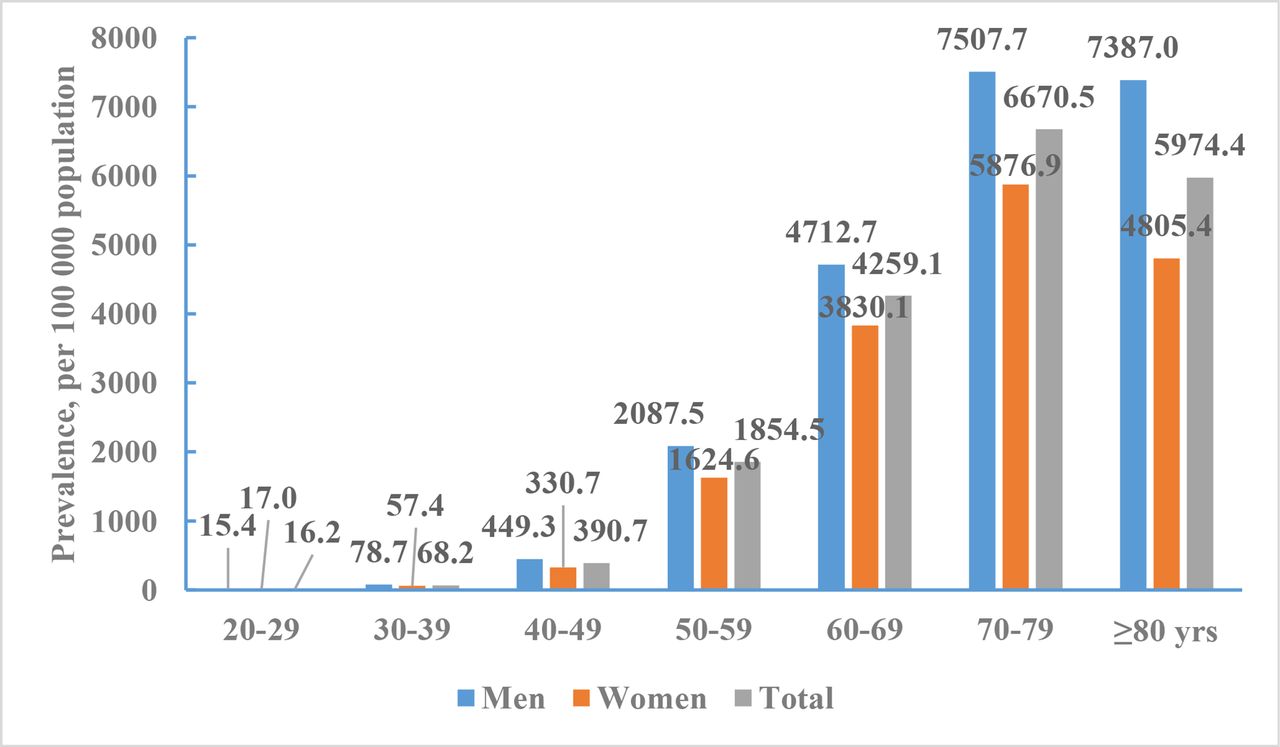
- Figure 5
Age-specific prevalence of stroke per 100 000 of Chinese adults by sex, National Epidemiological Survey of Stroke in China 2013.
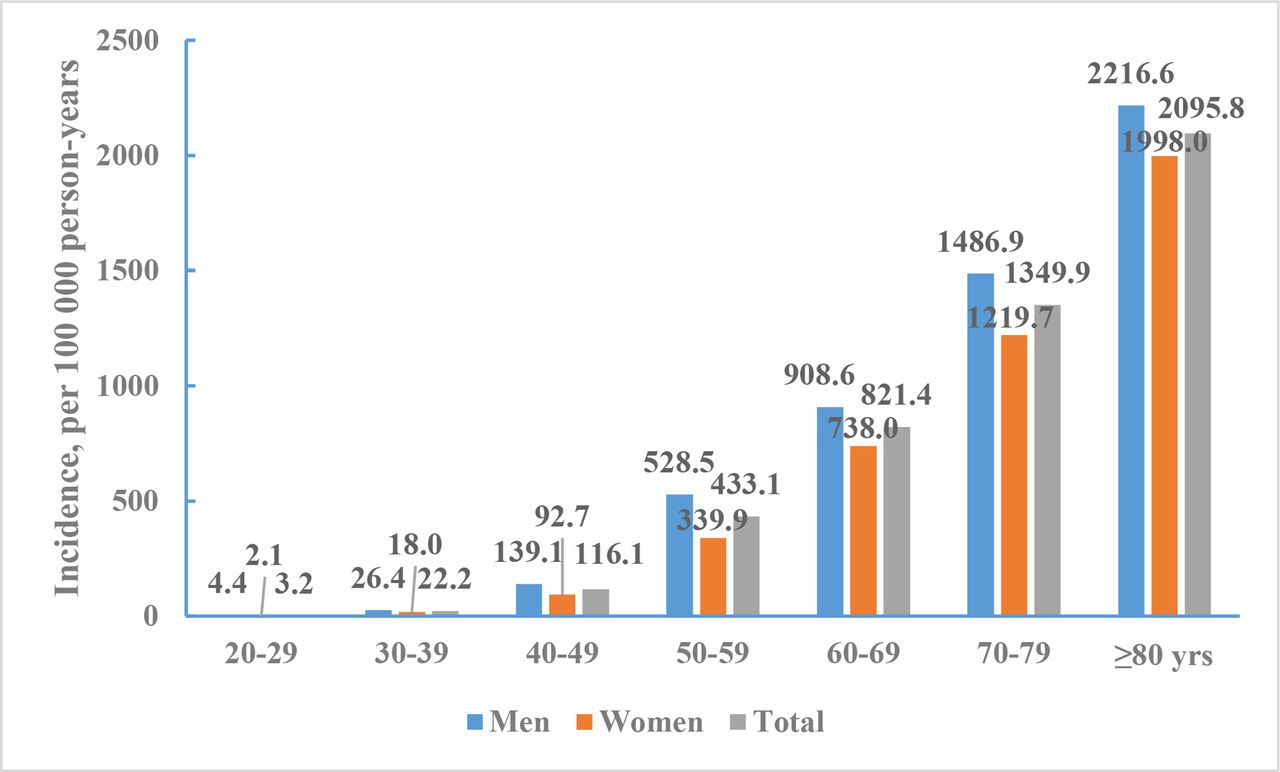
- Figure 6
Incidence rates of stroke per 100 000 person-years of Chinese adults (≥20 years) by sex, National Epidemiological Survey of Stroke in China 2013.
- Figure 7
Current tobacco smoking rate for adults aged 15 years and older by age and sex, China Global Adult Tobacco Survey 2018.
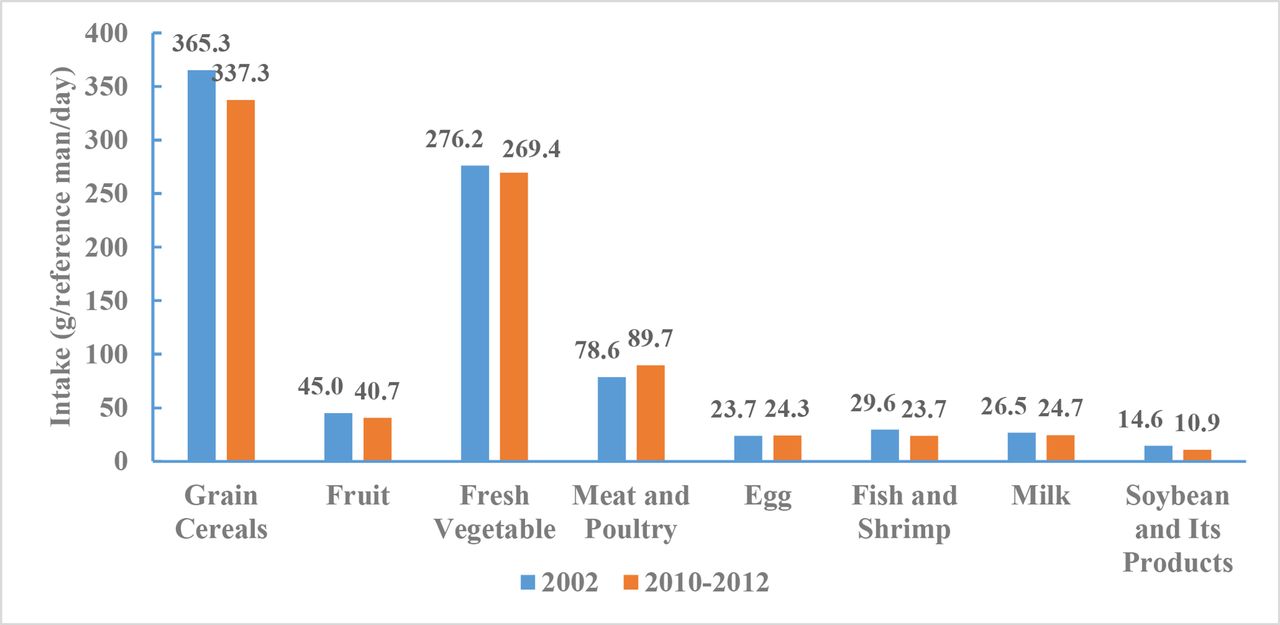
- Figure 8
Comparison of Chinese adults’ food consumption, Chinese Nutrition and Health Surveillance 2002 and 2010–2012.
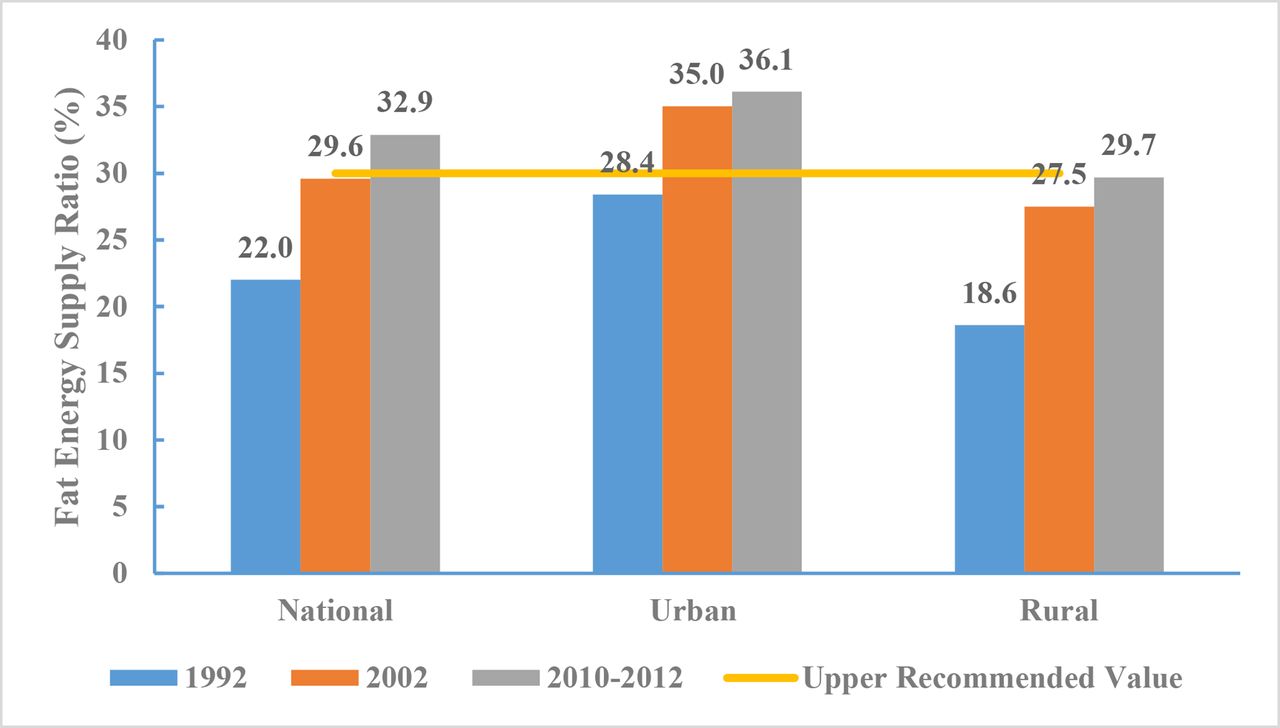
- Figure 9
Proportion of fat-based energy for Chinese adults by region, Chinese Nutrition and Health Surveillance 1992, 2002 and 2010–2012.
- Figure 10
Salt intake for Chinese adults by region, Chinese Nutrition and Health Surveillance 1992, 2002 and 2010–2012.
- Figure 11
Prevalence of overweight among Chinese adults by regions and age groups, Chinese Nutrition and Health Surveillance 2002 and 2010–2012 (Chinese standard for body mass index).
- Figure 12
Prevalence of obesity among Chinese adults by regions and age groups, Chinese Nutrition and Health Surveillance 2002 and 2010–2012 (Chinese standard for body mass index).
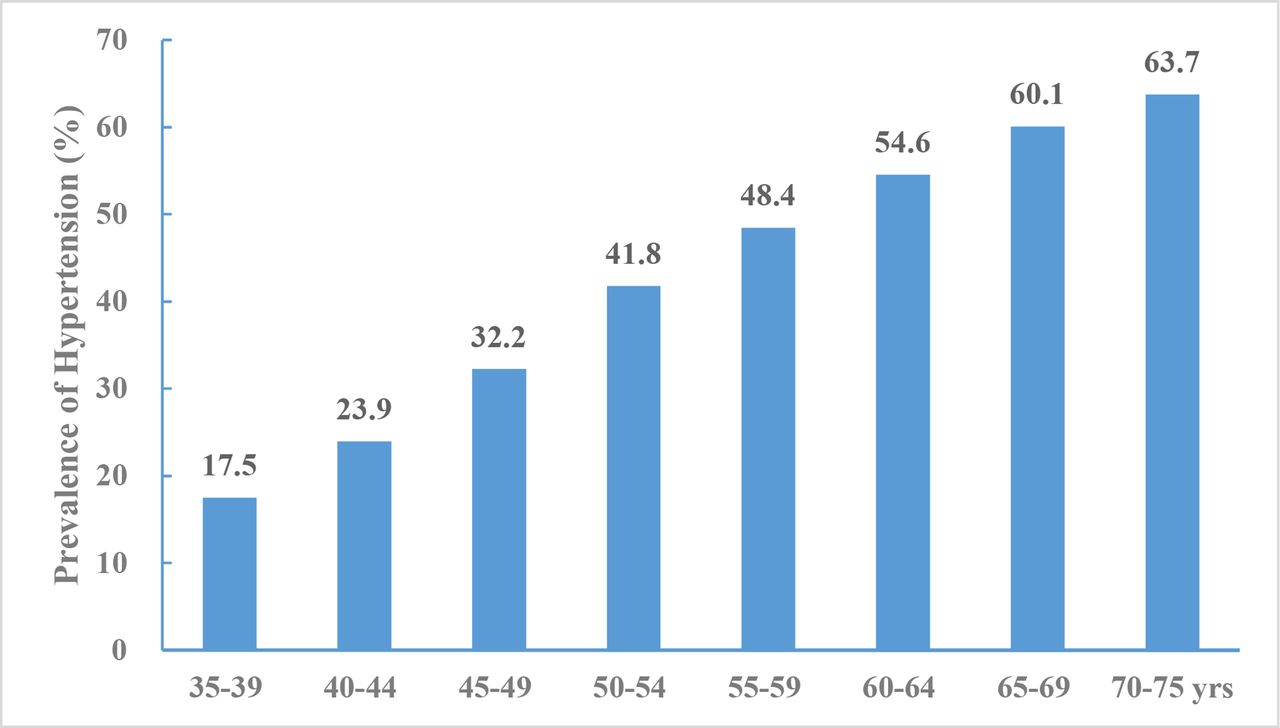
- Figure 13
Prevalence of hypertension aged 35–75 years, China Patient-Centered Evaluative Assessment of Cardiac Events (PEACE) Million Persons Project 2014–2017.
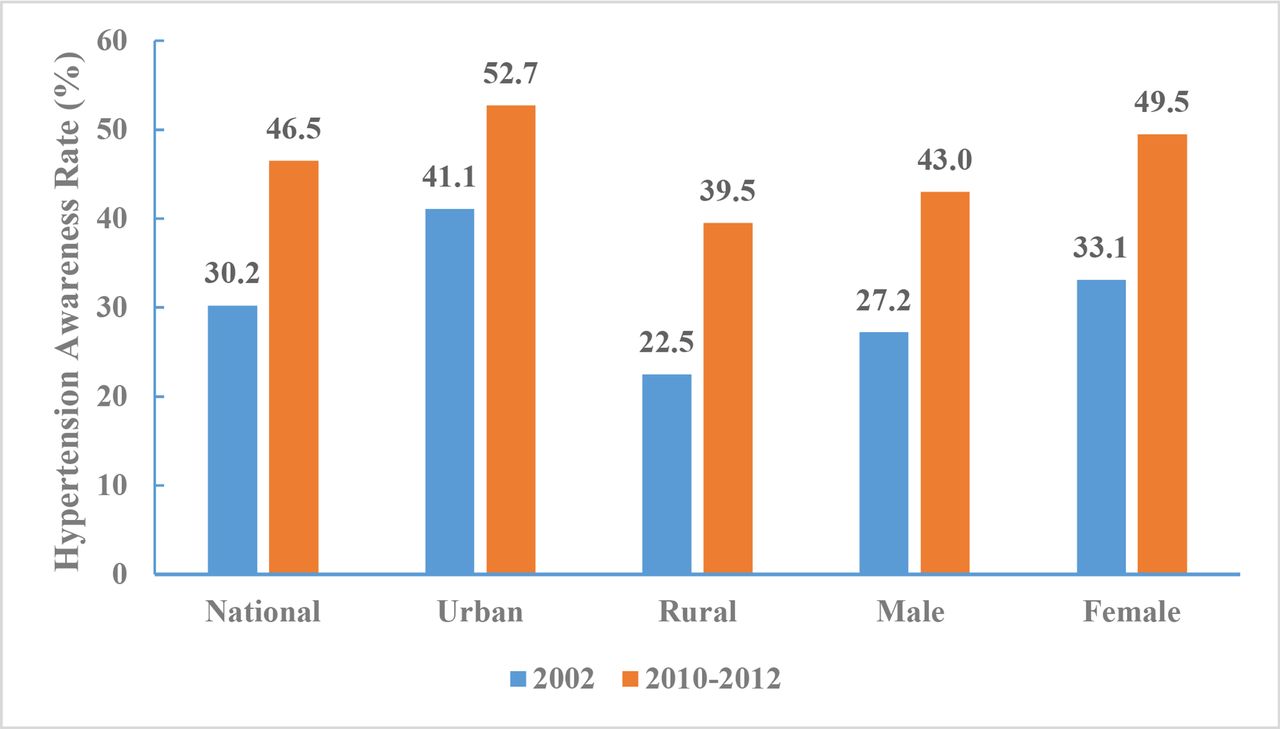
- Figure 14
Hypertension awareness rate of Chinese adults aged 18 years and above by region and sex, Chinese Nutrition and Health Surveillance 2002 and 2010–2012.
- Figure 15
Hypertension treatment rate of Chinese adults aged 18 years and above by region and sex, Chinese Nutrition and Health Surveillance 2002 and 2010–2012.
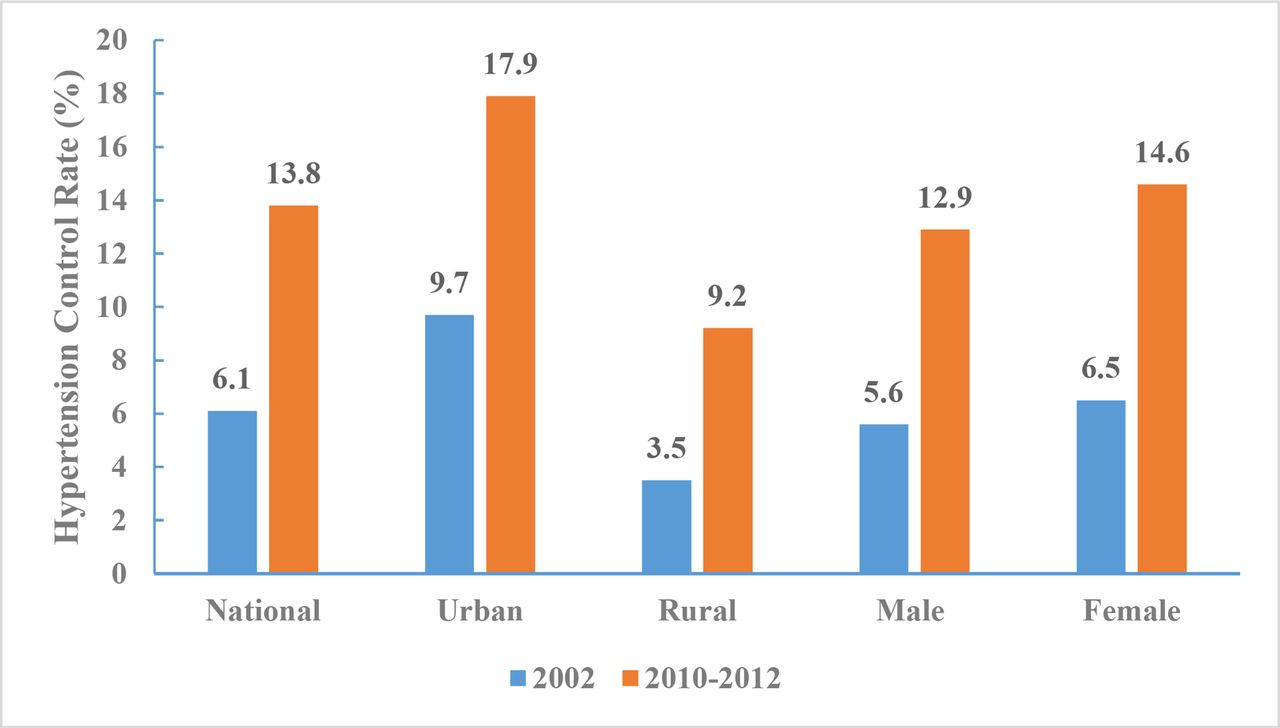
- Figure 16
Hypertension control rates for Chinese adults aged 18 years and above by region and sex, Chinese Nutrition and Health Surveillance 2002 and 2010–2012.
- Figure 17
Hypertension treatment and control rates for Chinese adults aged 18 years and above by region and sex, Chinese Nutrition and Health Surveillance 2002 and 2010–2012.
- Figure 18
Prevalence of dyslipidaemia in Chinese adults aged 18 years and above, Chinese Nutrition and Health Surveillance 2002, 2010–2012 and 2015.
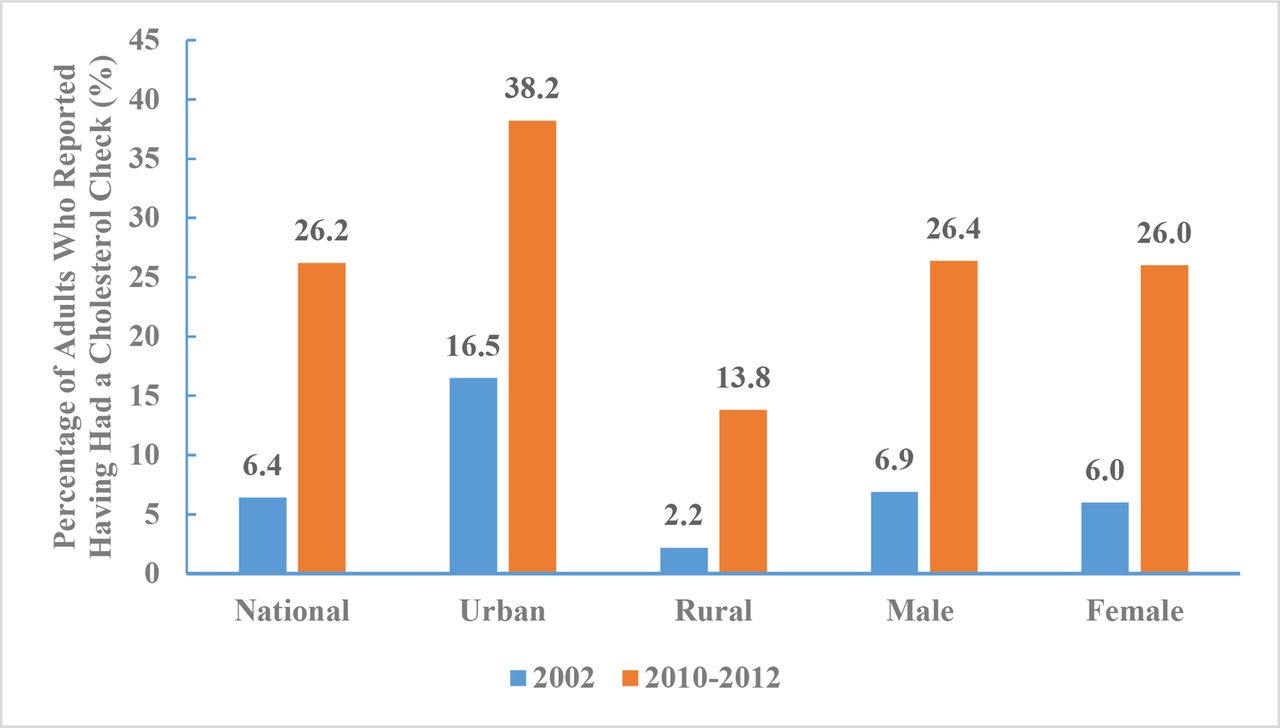
- Figure 19
Percentage of adults who reported having had a cholesterol check by regions and sex, Chinese Nutrition and Health Surveillance 2002 and 2010–2012.
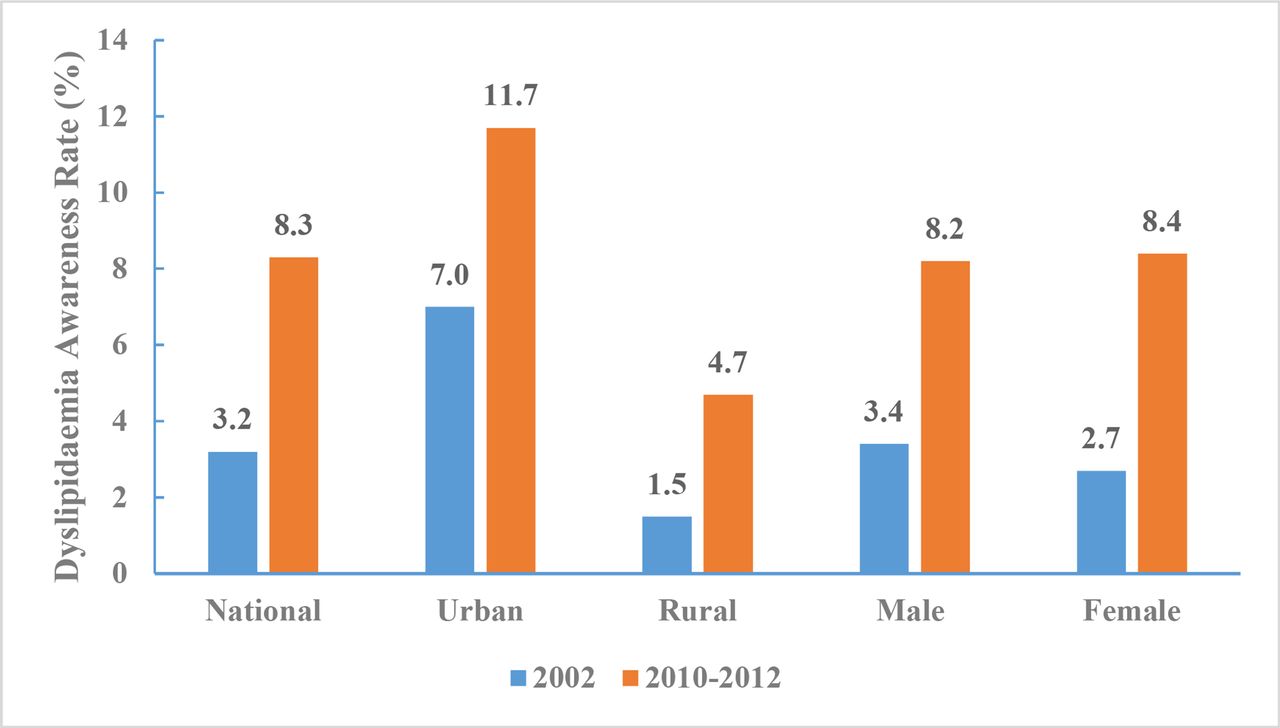
- Figure 20
Dyslipidaemia awareness rate of Chinese adults aged 18 years and above by region and sex, Chinese Nutrition and Health Surveillance 2002 and 2010–2012.
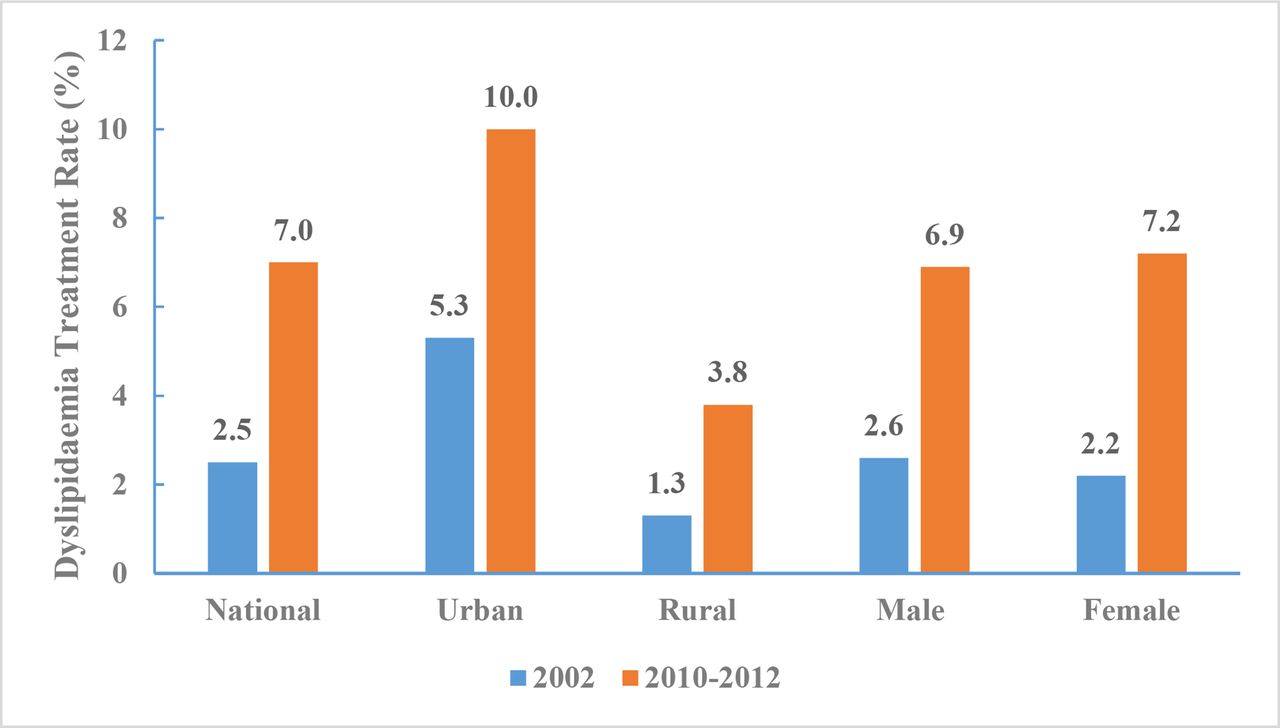
- Figure 21
Dyslipidaemia treatment rate of Chinese adults aged 18 years and above by region and sex, Chinese Nutrition and Health Surveillance 2002 and 2010–2012.
- Figure 22
Prevalence of atrial fibrillation among adults aged ≥40 years by region and sex, China National Stroke Screening and Prevention Project 2014–2015.
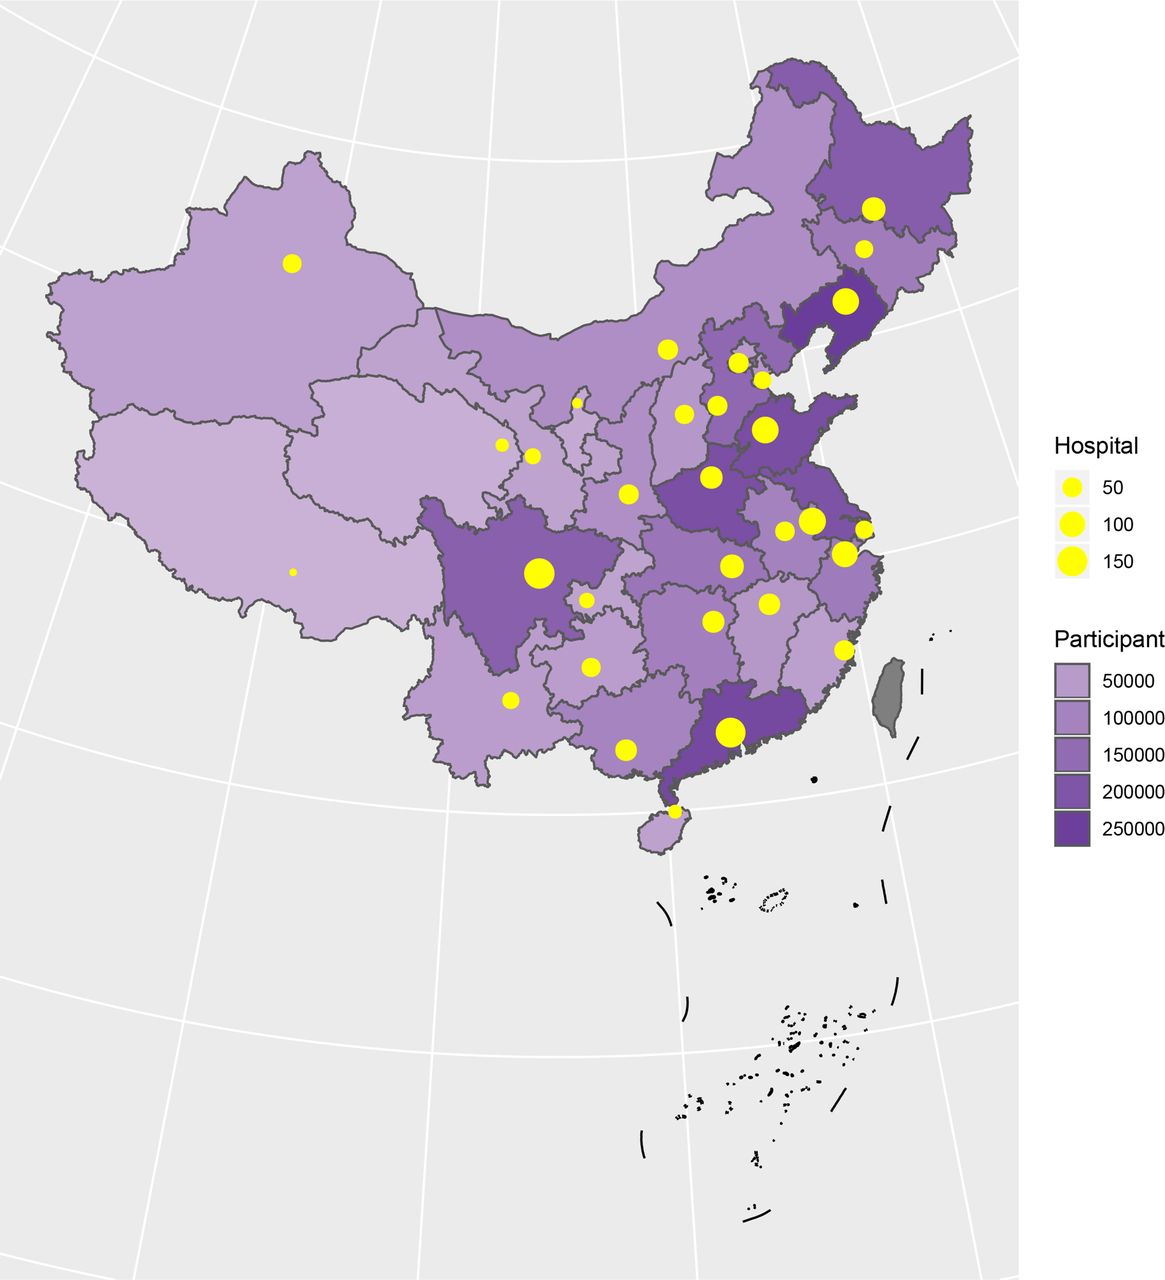
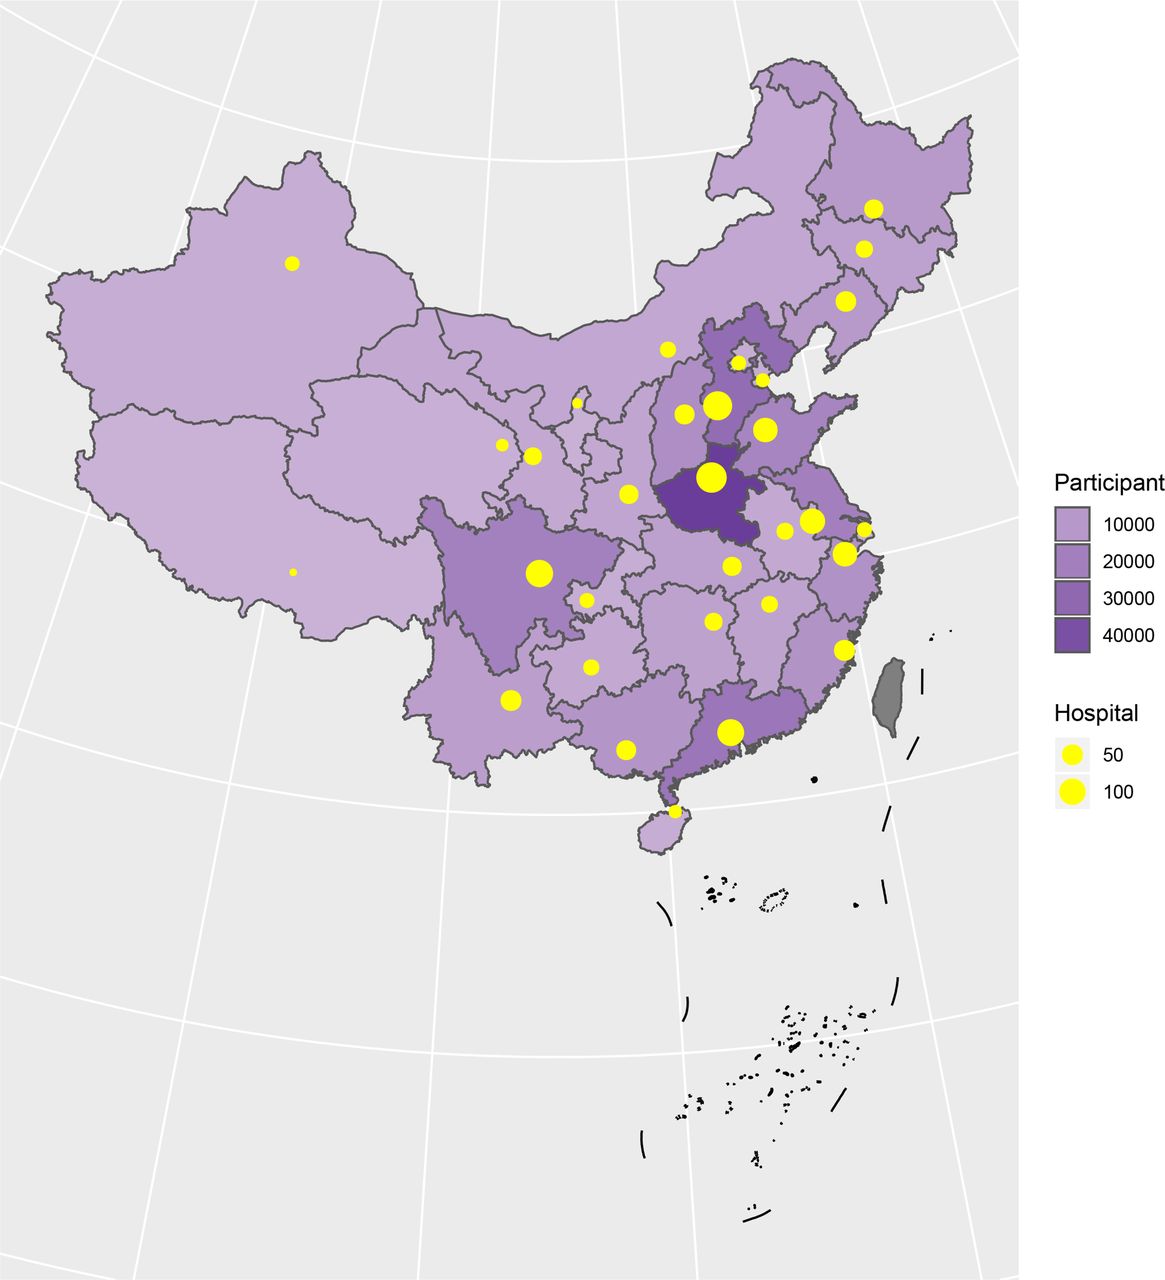
- Figure 23
Distribution of hospitals and participants from the Hospital Quality Monitoring System in 2018.
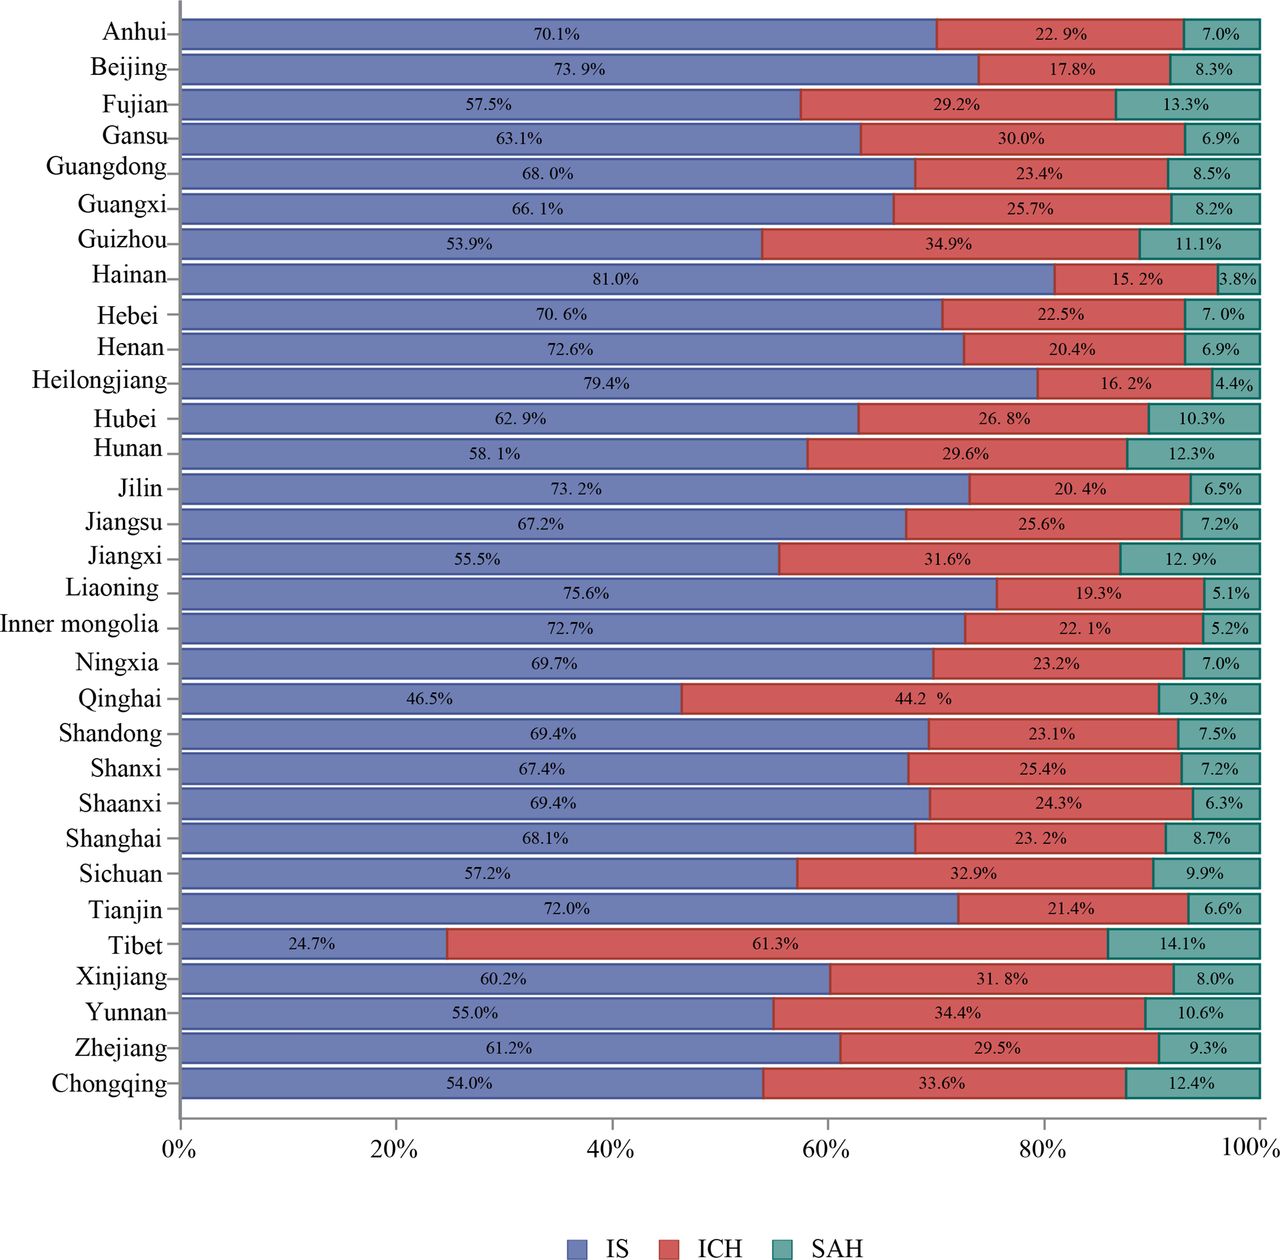
- Figure 24
Proportion of stroke type for in-hospital patients with stroke from the Hospital Quality Monitoring System in 2018 stratified by province.
- Figure 25
Risk factors or comorbidities for patients with ischaemic stroke from the Hospital Quality Monitoring System in 2018.
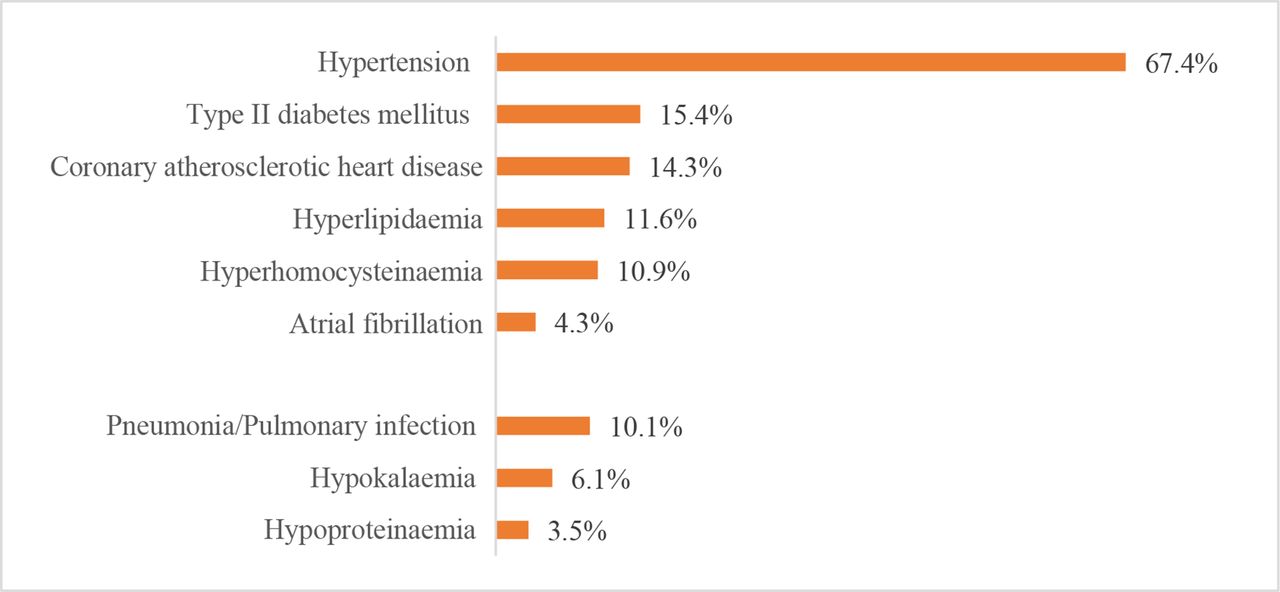
- Figure 26
Risk factors or comorbidities for patients with intracerebral haemorrhage from the Hospital Quality Monitoring System in 2018.
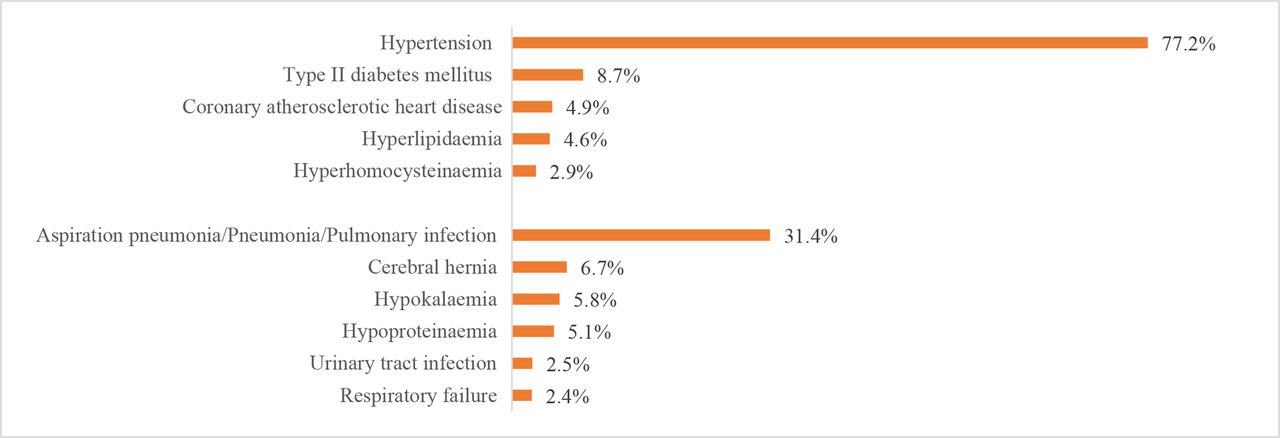
- Figure 27
Risk factors or comorbidities for patients with subarachnoid haemorrhage from the Hospital Quality Monitoring System in 2018.
- Figure 28
Distribution of hospitals and participants from Chinese Stroke Center Alliance in 2018.
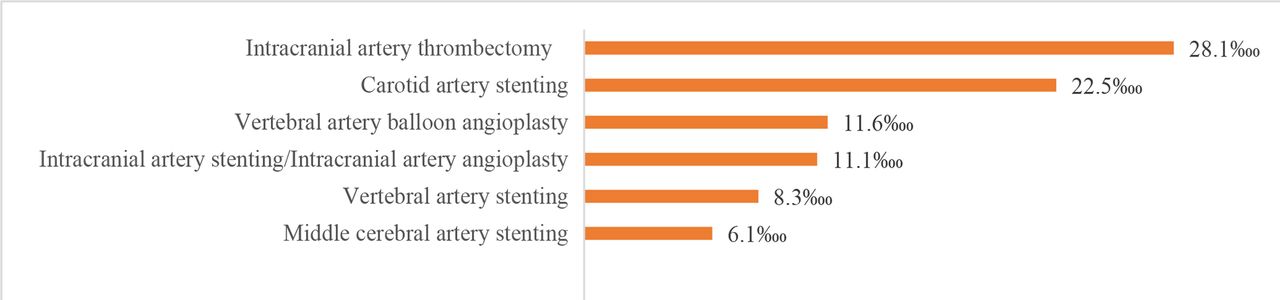
- Figure 29
Procedures for patients with ischaemic stroke from the Hospital Quality Monitoring System in 2018.
- Figure 30
Procedures for patients with intracerebral haemorrhage from the Hospital Quality Monitoring System in 2018.
- Figure 31
Intervention for patients with subarachnoid haemorrhage from the Hospital Quality Monitoring System in 2018.
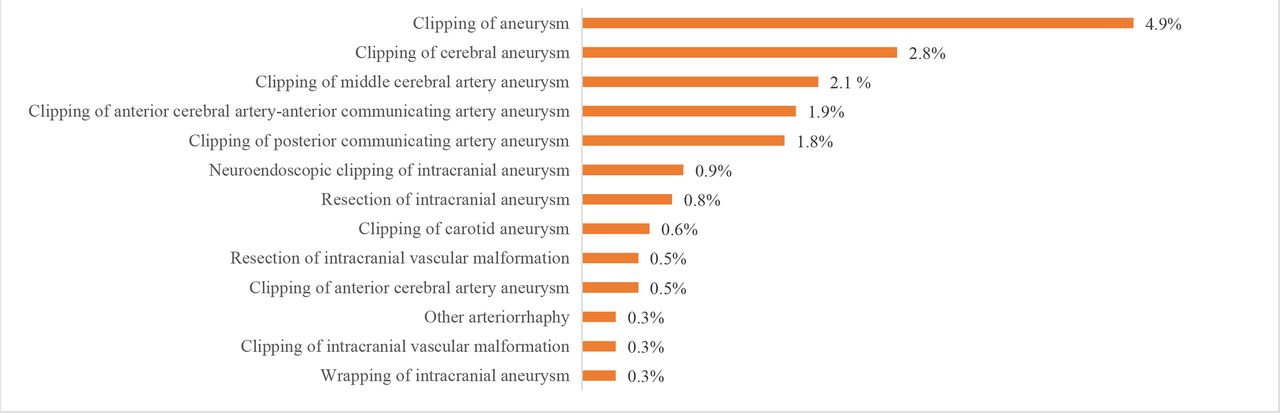
- Figure 32
Proceduresfor patients with subarachnoid haemorrhage from the Hospital Quality Monitoring System in 2018.
- Figure 33
In-hospital outcomes of patients with ischaemic stroke from the Hospital Quality Monitoring System in 2018 by province, autonomous region, or municipality. DAMA, discharge against medical advice.
- Figure 34
In-hospital outcomes of patients with intracerebral haemorrhage from the Hospital Quality Monitoring System in 2018 by province, autonomous region, or municipality. DAMA, discharge against medical advice.
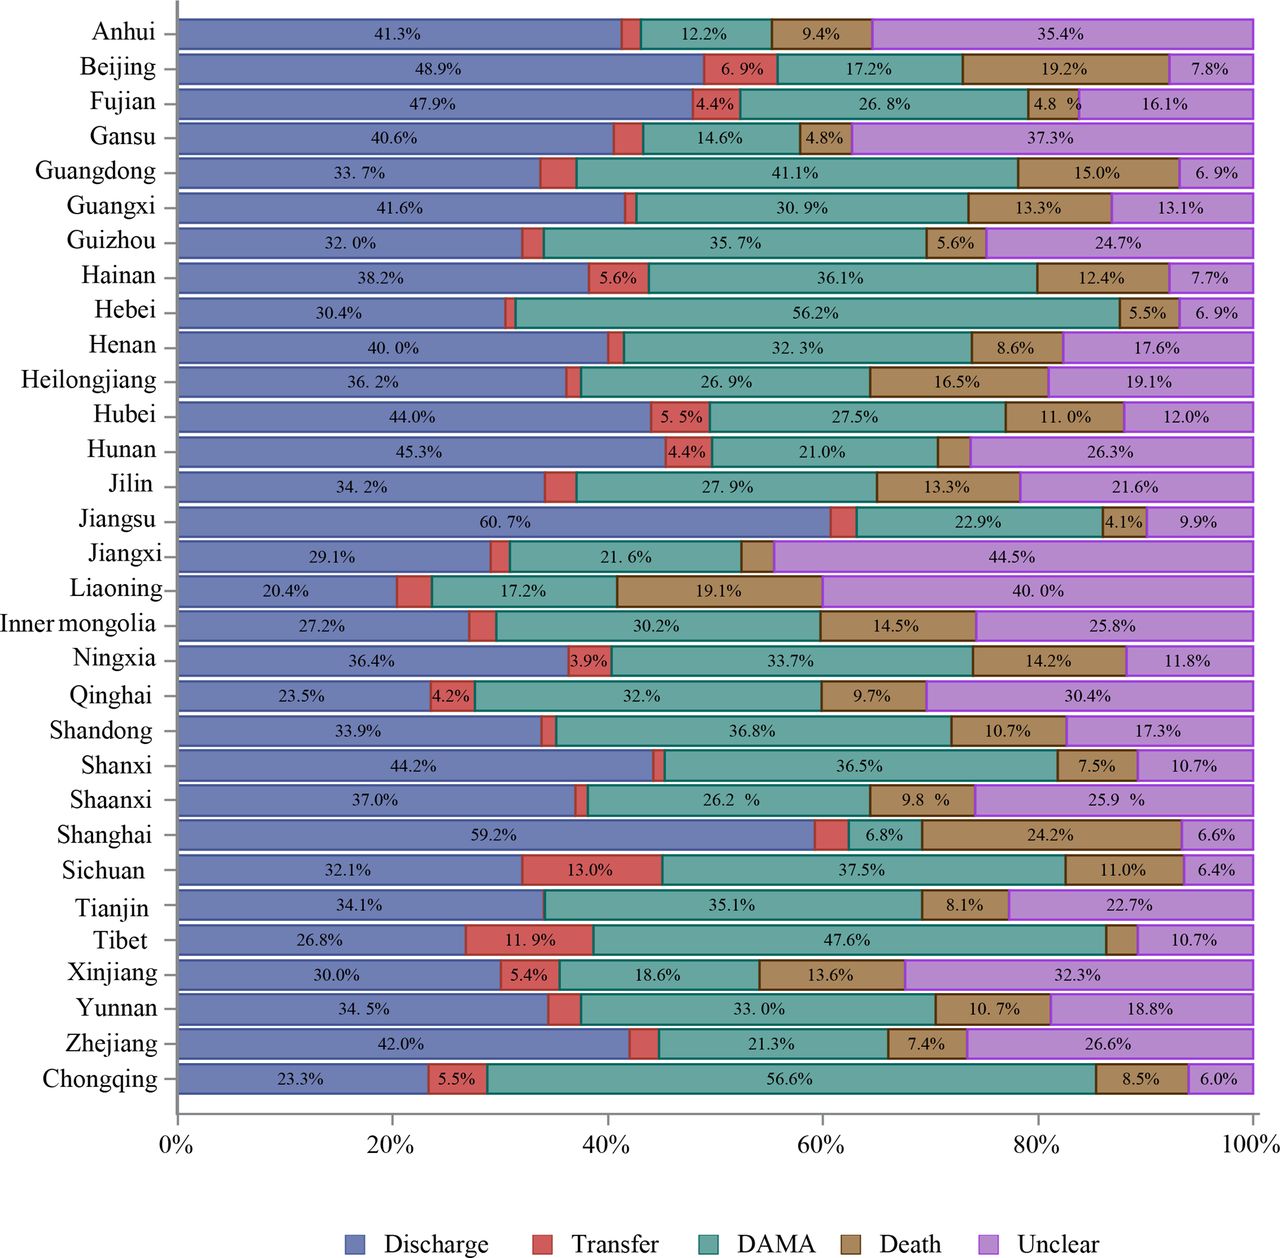
- Figure 35
In-hospital outcomes of patients with subarachnoid haemorrhage from the Hospital Quality Monitoring System in 2018 by province, autonomous region, or municipality. DAMA, discharge without medical advice.


Tables
- Table 1
Epidemiology of stroke and related risk factors and their data sources
Indicators Data sources Survey year Death rate of cerebrovascular disease National Mortality Surveillance 2018 Prevalence and incidence rate of stroke National Epidemiological Survey of Stroke 2013 Comorbidities in patients with ischaemic stroke National Epidemiological Survey of Stroke
China National Stroke Registry - I
China National Stroke Registry - II
China National Stroke Registry - III2013
2007–2008
2012–2013
2015–2018Tobacco use for adults (≥15 years of age) China Global Adult Tobacco Survey 2018 Food and nutrition for adults (≥18 years of age) Chinese Nutrition and Health Surveillance 2002
2010–2012Overweight and obesity for adults (≥18 years of age) Chinese Nutrition and Health Surveillance 2002
2010–2012Hypertension and its awareness, treatment and control for adults (≥18 years of age) Chinese Nutrition and Health Surveillance 2002
2010–2012Hypertension and its awareness, treatment and control (35–75 years of age) China Patient-Centered Evaluative Assessment of Cardiac Events (PEACE) Million Persons Project 2014–2017 Diabetes for adults (≥18 years of age) China Chronic Disease and Risk Factors Surveillance 2013 Blood lipid and its screening, awareness and treatment for adults (≥18 years of age) Chinese Nutrition and Health Surveillance
Chinese Nutrition and Health Surveillance
Chinese Adults Nutrition and Chronic Diseases Surveillance2002
2010–2012
2015Atrial fibrillation for adults (≥40 years of age) China National Stroke Screening and Prevention Project 2014–2015 - Table 2
ICD-10 disease code used for identification of patients with stroke and comorbidities and ICD-9-CM code used for identification of interventions or procedures
Disease ICD-10 Stroke Ischaemic stroke I63 Intracerebral haemorrhage stroke I61 Subarachnoid haemorrhage stroke I60 Comorbidities Hypertension I10 Diabetes mellitus E11.900 Hyperlipidaemia E78.500 Atrial fibrillation G91.900 Coronary atherosclerotic heart disease I25.103 Cardiac arrhythmia I49.900 Hyperuricaemia E79.001 Sequelae of cerebral infarction I69.300 Lacunar cerebral infarction I63.801 Encephalopathy G31.902 Cerebral hernia G93.501 Occlusion and stenosis of unspecified cerebral artery I66.901 Cerebral atherosclerosis I67.200 Pulmonary infection J98.414 Pneumonia J18.900 Aspiration pneumonia J69.001 Hydrothorax J94.804 Hypokalemia E87.600 Hypoproteinaemia E77.801 Fatty liver K76.000 Hyperplasia of prostate N40.x00 Procedures Intracranial artery thrombectomy 39.7400×002, 39.7401,39.7400 Carotid artery stenting 0.63 Vertebral artery balloon angioplasty 00.6400×009 Intracranial artery stenting/intracranial artery angioplasty 0.6500 to 0.6200 Vertebral artery stenting 00.6102 Middle cerebral artery stenting 00.6501 Evacuation of intracerebral haematoma/evacuation of intracranial haematoma/transtemporal evacuation of intracerebral haematoma 01.3900×009, 01.2408, 01.3904 Burr-hole drainage of ventricle/burr-hole decompression of skull 01.3901,01.2414 Stereotactic aspiration of intracranial haematoma/stereotactic puncture and drainage of intracranial haematoma/ hard tunnel puncture and drainage of intracranial haematoma 01.3905, 01.3900×013, 01.3900×003 Endoscopic drainage of haematoma 01.3906 Ventriculoperitoneal shunt/ventricoextracranial shunt 02.3400×002, 02.3900 Wrapping of intracranial aneurysm/resection of intracranial vascular malformation/clipping of carotid aneurysm 39.5101 Resection of intracranial aneurysm 38.6100×002 Neuroendoscopic clipping of intracranial aneurysm 39.5100×004 Clipping of posterior communicating artery aneurysm 39.5104 Clipping of anterior cerebral artery–anterior communicating artery aneurysm 39.5107 Clipping of middle cerebral artery aneurysm 39.5103 Clipping of cerebral aneurysm 39.5100×007 Clipping of aneurysm 39.5100 Interventions Intracranial aneurysm embolisation/intracranial aneurysm coil embolisation/intracranial aneurysm embolisation/middle cerebral aneurysm embolisation 39.7203, 39.7204, 39.7209, 39.7200×006 Intracranial artery stenting/intracranial artery stent-assist coil embolisation 00.6500×008, 00.6500, 39.7205 Intracranial and cervical artery occlusion 39.7500 to 39.7200 Carotid aneurysm embolisation 39.7206 Carotid aneurysm coil embolisation 39.7207 Internal carotid embolisation 39.7200×004 Carotid artery stenting 00.6300 Wrapping of intracranial aneurysm 39.5201 Clipping of intracranial vascular malformation 38.8101 Other arteriorrhaphy 39.5200 Clipping of anterior cerebral artery aneurysm 39.5102 Resection of intracranial vascular malformation 38.6101 Clipping of carotid aneurysm 39.5101 Resection of intracranial aneurysm 38.6100×002 Neuroendoscopic clipping of intracranial aneurysm 39.5100×004 Clipping of posterior communicating artery aneurysm 39.5104 Clipping of anterior cerebral artery–anterior communicating artery aneurysm 39.5107 Clipping of middle cerebral artery aneurysm 39.5103 Clipping of cerebral aneurysm 39.5100×007 Clipping of aneurysm 39.5100 ICD-10, International Classification of Diseases, 10th Revision; ICD-9-CM, International Classification of Diseases, Ninth Revision, Clinical Modification.
- Table 3
Specifications of guideline-recommended performance measures
Performance measure of IS care Performance measure definition for eligible patients* Acute performance measures Intravenous rtPA <4.5 hours Intravenous rtPA in patients who arrive within 3.5 hours after initial symptom onset and treated within 4.5 hours Endovascular treatment <6 hours Mechanical endovascular reperfusion therapy for acute IS caused by arterial occlusion of proximal anterior circulation within 6 hours after admission Early antithrombotics Antithrombotic therapy prescribed within 2 days of hospitalisation, including antiplatelet or anticoagulant therapy DVT prophylaxis Patients at risk for DVT (non-ambulatory) who underwent DVT prophylaxis by the end of hospital day 2, including pneumatic compression, warfarin sodium, heparin sodium or new oral anticoagulants Dysphagia screening Dysphagia screening prior to any oral intake Rehabilitation assessment Assessed for stroke rehabilitation services Performance measures at discharge Antithrombotic medication Antithrombotic therapy prescribed at discharge Anticoagulation for AF Anticoagulation prescribed at discharge for patients with AF or atrial flutter documented during the hospitalisation Antihypertensive medicines for patients with hypertension Antihypertension medication prescribed at discharge for patients with history of hypertension disease or hypertension disease documented during the hospitalisation Hypoglycaemic medication for diabetes mellitus Hypoglycaemic medication prescribed at discharge for patients with history of diabetes mellitus or diabetes mellitus documented during the hospitalisation Statin for lowering LDL≥100 mg/dL Statin prescribed at discharge if LDL≥100 mg/dL, if patient treated with lipid-lowering agent prior to admission, or LDL not documented, hypoglycaemic medication for diabetes mellitus Smoking cessation Smoking cessation intervention (counselling or medication) prior to discharge for current or recent smokers Stroke education Stroke education provided to patient and/or caregiver, including all five components: modifiable risk factors, stroke warning sign and symptoms, how to activate emergency medical services, need for follow-up and medications prescribed *Eligible patients are those without any medical contraindications (eg, treatment intolerance, excessive risk of adverse reaction, patient/family refusal, or terminal illness/comfort care only) documented as reasons for non-treatment for each of the applicable measures. Acute performance measures, except for the rtPA measure, exclude patients who died before the end of day 2 of the hospital stay. Performance measures at discharge exclude patients who died during hospitalisation.
AF, atrial fibrillation; DVT, deep vein thrombosis; IS, ischaemic stroke; LDL, low-density lipoprotein; rtPA, recombinant tissue plasminogen activator.
- Table 4
Prevalence of some risk factors in stroke survivors by sex and residency, National Epidemiological Survey of Stroke in China 2013
Sex (%) Urban and rural (%) Total (%) Men Women Urban Rural Hypertension 83.71 84.89 84.42 84.09 84.24 Diabetes mellitus* 12.78 15.89 17.51 11.35 14.18 Dyslipidaemia* 20.63 23.18 27.08 17.26 21.78 Atrial fibrillation* 2.35 3.07 3.48 1.98 2.67 Coronary heart disease* 14.89 19.10 20.11 13.95 16.79 Current smoker† 72.28 17.54 46.91 48.24 47.63 Alcohol drinking† 65.66 17.42 44.45 43.51 43.94 *These risk factors were significantly different by sex and residency (p<0.05).
†These risk factors were significantly different between men and women (p<0.05).
- Table 5
Prevalence of risk factors in patients with ischaemic stroke, CNSRs I–III
CNSR-I
2007–2008 (%)CNSR-II
2012–2013 (%)CNSR-III
2015–2018 (%)Previous stroke/TIA 34.1 35.6 23.9 Diabetes mellitus 21.6 20.7 23.5 Hypertension 63.9 64.8 63.0 Dyslipidaemia 11.2 12.1 7.6 CHD/previous MI 14.5 13.5 10.5 Atrial fibrillation 7.4 7.0 6.9 Ever smoking 39.8 44.2 31.7 CHD, coronary heart disease; CNSR, China National Stroke Registry; MI, myocardial infarction; TIA, transient ischaemic attack.
- Table 6
Prevalence of tobacco use for adults ≥15 years of age by sex, China Global Adult Tobacco Survey 2018
Overall (%) Men (%) Women (%) Tobacco smokers Current tobacco smokers 26.6 50.5 2.1 Daily tobacco smokers 23.2 44.4 1.6 Secondhand smoke Adults exposed to tobacco smoke at the workplace* 50.9 60.5 39.6 Adults exposed to tobacco smoke at home† 44.9 51.7 37.9 *Among those who work outside of the home who usually work indoors or both indoors and outdoors.
†Smoking occurs in the home at least monthly.
- Table 7
Prevalence of hypertension for adults ≥18 years of age by region and sex, Chinese Nutrition and Health Surveillance 2010–2012
National Urban Rural Total 25.2 26.8 23.5 Men 26.2 28.1 24.2 Women 24.1 25.4 22.8 18–44 years Subtotal 10.6 11.3 10.0 Men 13.6 14.6 12.7 Women 7.3 7.6 6.9 45–59 years Subtotal 35.7 36.6 34.7 Men 35.9 37.9 33.6 Women 35.5 35.2 35.9 60+ years Subtotal 58.9 60.6 57.0 Men 56.5 57.6 55.3 Women 61.2 63.4 58.7 - Table 8
Weighted prevalence, awareness rate, treatment rate and control rate of diabetes among Chinese adults from China Chronic Disease and Risk Factors Surveillance in 2013
Total diabetes Pre-diabetes Awareness of diabetes Treatment of diabetes Control of diabetes Overall 10.9 35.7 36.5 32.2 49.2 Age groups (years) <40 5.9 28.8 22.8 20.0 56.0 40–59 12.9 39.5 39.0 34.5 47.0 ≥60 20.2 45.8 43.5 38.4 49.3 Sex Women 10.2 35.0 39.8 35.3 48.5 Men 11.7 36.4 33.5 29.5 49.9 Location Urban 12.6 34.3 43.1 38.4 53.3 Rural 9.5 37.0 29.1 25.2 42.3 - Table 9
Admission of in-patients with stroke from Hospital Quality Monitoring System in 2018
Variables Total
(n=3 010 204 (100%))IS
(n=2 466 785 (81.9%))ICH
(n=447 609 (14.9%))SAH
(n=95 810
(3.2%))Admission Other 362 176 (12.0) 300 091 (12.2) 52 145 (11.6) 9940 (10.4) Emergency 1 113 395 (37.0) 810 693 (32.9) 246 281 (55.0) 56 421 (58.9) Clinic 1 500 439 (49.8) 1 330 705 (53.9) 142 647 (31.9) 27 087 (28.3) Transfer 34 194 (1.1) 25 296 (1.0) 6536 (1.5) 2362 (2.5) Admission day Monday 524 402 (17.4) 440 525 (17.9) 69 340 (15.5) 14 537 (15.2) Tuesday 470 785 (15.6) 390 573 (15.8) 66 097 (14.8) 14 115 (14.7) Wednesday 452 805 (15.0) 373 970 (15.2) 64 876 (14.5) 13 959 (14.6) Thursday 442 845 (14.7) 364 341 (14.8) 64 739 (14.5) 13 765 (14.4) Friday 438 835 (14.6) 359 499 (14.6) 65 465 (14.6) 13 871 (14.5) Saturday 352 261 (11.7) 279 510 (11.3) 59 667 (13.3) 13 084 (13.7) Sunday 328 271 (10.9) 258 367 (10.5) 57 425 (12.8) 12 479 (13.0) ICH, intracerebral haemorrhage; IS, ischaemic stroke; SAH, subarachnoid haemorrhage.
- Table 10
Characteristics of in-patients with stroke from the Hospital Quality Monitoring System in 2018
Variables Total
(n=3 010 204(100%))IS
(n=2 466 785 (81.9%))ICH
(n=447 609 (14.9%))SAH
(n=95 810 (3.2%))Sex Male 1 784 347 (59.3) 1 460 467 (59.2) 284 065 (63.5) 39 815 (41.6) Female 1 225 857 (40.7) 1 006 318 (40.8) 163 544 (36.5) 55 995 (58.4) Age, mean±SD 66.1±12.8 67.3±12.1 61.2±14.0 58.4±14.4 Age, median (IQR) 67.0 (57.0–76.0) 68.0 (59.0–76.0) 62.0 (52.0–71.0) 59.0 (50.0–68.0) Insurance URBMI 1 063 892 (35.3) 932 502 (37.8) 110 358 (24.7) 21 032 (22.0) UEBMI 699 513 (23.2) 563 963 (22.9) 112 805 (25.2) 22 745 (23.7) NRCMS 489 361 (16.3) 379 973 (15.4) 89 838 (20.1) 19 550 (20.4) Self-pay 321 318 (10.7) 229 797 (9.3) 72 984 (16.3) 18 537 (19.3) Other 436 120 (14.5) 360 550 (14.6) 61 624 (13.8) 13 946 (14.6) ICH, intracerebral haemorrhage; IS, ischaemic stroke; NRCMS, new rural cooperative medical schema; SAH, subarachnoid haemorrhage; UEBMI, urban employee basic medical insurance; URBMI, urban resident basic medical insurance.
- Table 11
Geographical distribution of in-patients with stroke from the Hospital Quality Monitoring System in 2018
Variables Total
(n=3 010 204 (100%))IS
(n=2 466 785 (81.9%))ICH
(n=447 609 (14.9%))SAH
(n=95 810 (3.2%))Geographical distribution Anhui 103 116 (3.4) 86 149 (3.5) 14 101 (3.2) 2866 (3.0) Beijing 53 003 (1.8) 45 777 (1.9) 5519 (1.2) 1707 (1.8) Fujian 40 616 (1.3) 30 512 (1.2) 7752 (1.7) 2352 (2.5) Gansu 32 806 (1.1) 25 737 (1.0) 6127 (1.4) 942 (1.0) Guangdong 227 357 (7.6) 187 282 (7.6) 32 259 (7.2) 7816 (8.2) Guangxi 97 243 (3.2) 78 676 (3.2) 15 314 (3.4) 3253 (3.4) Guizhou 44 168 (1.5) 31 717 (1.3) 10 270 (2.3) 2181 (2.3) Hainan 34 925 (1.2) 31 484 (1.3) 2944 (0.7) 497 (0.5) Hebei 158 322 (5.3) 132 826 (5.4) 21 131 (4.7) 4365 (4.6) Henan 213 814 (7.1) 182 358 (7.4) 25 650 (5.7) 5806 (6.1) Heilongjiang 183 046 (6.1) 163 356 (6.6) 16 680 (3.7) 3010 (3.1) Hubei 130 052 (4.3) 102 556 (4.2) 21 895 (4.9) 5601 (5.8) Hunan 106 151 (3.5) 80 124 (3.2) 20 399 (4.6) 5628 (5.9) Jilin 114 379 (3.8) 97 868 (4.0) 13 630 (3.0) 2881 (3.0) Jiangsu 204 413 (6.8) 166 696 (6.8) 31 755 (7.1) 5962 (6.2) Jiangxi 58 123 (1.9) 42 650 (1.7) 12 165 (2.7) 3308 (3.5) Liaoning 254 149 (8.4) 221 027 (9.0) 28 139 (6.3) 4983 (5.2) Inner Mongolia 76 376 (2.5) 64 937 (2.6) 9883 (2.2) 1556 (1.6) Ningxia 16 661 (0.6) 13 883 (0.6) 2313 (0.5) 465 (0.5) Qinghai 6898 (0.2) 4472 (0.2) 2127 (0.5) 299 (0.3) Shandong 215 365 (7.2) 179 071 (7.3) 29 810 (6.7) 6484 (6.8) Shanxi 57 230 (1.9) 46 766 (1.9) 8798 (2.0) 1666 (1.7) Shannxi 74 292 (2.5) 61 643 (2.5) 10 799 (2.4) 1850 (1.9) Shanghai 39 673 (1.3) 32 697 (1.3) 5582 (1.2) 1394 (1.5) Sichuan 177 402 (5.9) 131 854 (5.3) 37 958 (8.5) 7590 (7.9) Tianjin 58 340 (1.9) 49 493 (2.0) 7335 (1.6) 1512 (1.6) Tibet 999 (0.0) 411 (0.0) 510 (0.1) 78 (0.1) Xingjian 35 639 (1.2) 27 244 (1.1) 7195 (1.6) 1200 (1.3) Yunnan 44 494 (1.5) 32 298 (1.3) 10 116 (2.3) 2080 (2.2) Zhejiang 117 845 (3.9) 91 224 (3.7) 21 980 (4.9) 4641 (4.8) Chongqing 33 307 (1.1) 23 997 (1.0) 7473 (1.7) 1837 (1.9) ICH, intracerebral haemorrhage; IS, ischaemic stroke; SAH, subarachnoid haemorrhage.
- Table 12
Inpatients with ischaemic stroke from the Hospital Quality Monitoring System in 2018 by age and sex
Variables Total
(n=2 466 785 (100%))Male
(n=1 460 467 (59.2%))Female
(n=1 006 318 (40.8%))Age (years) <18 1555 (0.1) 936 (0.1) 619 (0.1) 18–24 1258 (0.1) 757 (0.1) 501 (0.0) 25–29 3611 (0.1) 2541 (0.2) 1070 (0.1) 30–34 8600 (0.3) 6542 (0.4) 2058 (0.2) 35–39 18 521 (0.8) 14 554 (1.0) 3967 (0.4) 40–44 42 521 (1.7) 31 925 (2.2) 10 596 (1.1) 45–49 109 070 (4.4) 77 032 (5.3) 32 038 (3.2) 50–54 197 522 (8.0) 131 870 (9.0) 65 652 (6.5) 55–59 240 695 (9.8) 158 180 (10.8) 82 515 (8.2) 60–64 357 504 (14.5) 219 813 (15.1) 137 691 (13.7) 65–69 398 120 (16.1) 229 912 (15.7) 168 208 (16.7) 70–74 350 936 (14.2) 194 747 (13.3) 156 189 (15.5) 75–79 316 267 (12.8) 168 082 (11.5) 148 185 (14.7) 80–84 246 343 (10.0) 126 991 (8.7) 119 352 (11.9) 85+ 174 262 (7.1) 96 585 (6.6) 77 677 (7.7) - Table 13
Inpatients with intracerebral haemorrhage from the Hospital Quality Monitoring System in 2018 by age and sex
Variables Total
(n=447 609 (100%))Male
(n=284 065 (63.5%))Female
(n=163 544 (36.5%))Age (years) <18 2774 (0.6) 1617 (0.6) 1157 (0.7) 18–24 1710 (0.4) 1100 (0.4) 610 (0.4) 25–29 2757 (0.6) 1938 (0.7) 819 (0.5) 30–34 5712 (1.3) 4364 (1.5) 1348 (0.8) 35–39 11 329 (2.5) 9115 (3.2) 2214 (1.4) 40–44 20 670 (4.6) 15 838 (5.6) 4832 (3.0) 45–49 41 279 (9.2) 28 817 (10.1) 12 462 (7.6) 50–54 59 147 (13.2) 37 494 (13.2) 21 653 (13.2) 55–59 51 790 (11.6) 33 360 (11.7) 18 430 (11.3) 60–64 61 613 (13.8) 39 562 (13.9) 22 051 (13.5) 65–69 61 129 (13.7) 37 814 (13.3) 23 315 (14.3) 70–74 47 388 (10.6) 28 423 (10.0) 18 965 (11.6) 75–79 37 221 (8.3) 21 529 (7.6) 15 692 (9.6) 80–84 26 497 (5.9) 14 541 (5.1) 11 956 (7.3) 85+ 16 593 (3.7) 8553 (3.0) 8040 (4.9) - Table 14
In-patients with subarachnoid haemorrhage from the Hospital Quality Monitoring System in 2018 by age and sex
Variables Total
(n=95 810 (100%))Male
(n=39 815 (41.6%))Female
(n=55 995 (58.4%))Age (years) <18 1347 (1.4) 841 (2.1) 506 (0.9) 18–24 764 (0.8) 500 (1.3) 264 (0.5) 25–29 1000 (1.0) 637 (1.6) 363 (0.6) 30–34 1622 (1.7) 1065 (2.7) 557 (1.0) 35–39 2625 (2.7) 1534 (3.9) 1091 (1.9) 40–44 5123 (5.3) 2690 (6.8) 2433 (4.3) 45–49 10 470 (10.9) 4966 (12.5) 5504 (9.8) 50–54 13 883 (14.5) 6199 (15.6) 7684 (13.7) 55–59 11 555 (12.1) 5084 (12.8) 6471 (11.6) 60–64 14 586 (15.2) 5715 (14.4) 8871 (15.8) 65–69 12 570 (13.1) 4342 (10.9) 8228 (14.7) 70–74 8670 (9.0) 2787 (7.0) 5883 (10.5) 75–79 5798 (6.1) 1701 (4.3) 4097 (7.3) 80–84 3698 (3.9) 1105 (2.8) 2593 (4.6) 85+ 2099 (2.2) 649 (1.6) 1450 (2.6) - Table 15
Key performance indicators of ischaemic stroke from Chinese Stroke Center Alliance in 2018
Key performance indicators Relative frequency % (95% CI) Acute performance measures Intravenous rtPA≤4.5 hours 16 270/67 122 24.2 (23.9% to 24.6%) Early antithrombotics 223 740/264 348 84.6 (84.5% to 84.8%) DVT prophylaxis 35 321/83 605 42.3 (41.9% to 42.6%) Discharge performance measures Antithrombotics 229 080/261 594 87.6 (87.4% to 87.7%) Anticoagulants for AF 8448/19 283 43.8 (43.1% to 44.5%) BP lowering for HTN 130 477/202 912 64.3 (64.1% to 64.5%) Glucose-lowering for hyperglycaemic 59 039/75 330 78.4 (78.1% to 78.7%) Statin for LDL 238 145/266 767 89.3 (89.2% to 89.4%) Additional quality measures Smoking cessation 61 221/63 630 96.2 (96.1% to 96.4%) Dysphagia screen 214 407/269 428 79.6 (79.4% to 79.7%) Rehabilitation 202 787/269 428 75.3 (75.1% to 75.4%) Summary performance measures Composite score 0.77±0.21 All-or-none measure 73 017/269 428 27.1 (26.9% to 27.3%) AF, atrial fibrillation; BP, blood pressure; DVT, deep vein thrombosis; HTN, hypertension; LDL, low-density lipoprotein; rtPA, recombinant tissue plasminogen activator.
- Table 16
Key performance indicators of intracerebral haemorrhage from Chinese Stroke Center Alliance in 2018
Key performance indicators Relative frequency % (95% CI) DVT prophylaxis 6938/14 902 46.6 (45.8% to 47.4%) BP lowering for HTN 17 505/20 748 84.4 (83.9% to 84.9%) Smoking cessation 4354/4640 93.8 (93.1% to 94.5%) Dysphagia screen 17 330/24 556 70.6 (70.0% to 71.1%) Rehabilitation 18 333/24 556 74.7 (74.1% to 75.2%) Summary performance measures Composite score 0.72±0.28 All-or-none 9149/24 556 37.3 (36.7% to 37.9%) BP, blood pressure; DVR, deep vein thrombosis; HTN, hypertension.
- Table 17
Key performance indicators of subarachnoid haemorrhage from Chinese Stroke Center Alliance in 2018
Key performance indicators Relative frequency % (95% CI) DVT prophylaxis 752/1940 38.8 (36.6% to 40.9%) BP lowering for HTN 1391/1975 70.4 (68.4% to 72.4%) Smoking cessation 429/470 91.3 (88.7% to 93.8%) Dysphagia screen 1971/3343 59.0 (57.3% to 60.6%) Rehabilitation 1995/3343 59.7 (58.0% to 61.3%) Summary performance measures Composite score 0.59±0.32 All-or-none 847/3343 25.3 (23.9% to 26.8%) BP, blood pressure; DVT, deep vein thrombosis; HTN, hypertension.
- Table 18
In-hospital outcomes of patients with stroke from the Hospital Quality Monitoring System in 2018
Variables Total
(n=3 010 204 (100%))IS
(n=2 466 785(81.9%))ICH
(n=447 609(14.9%))SAH
(n=95 810 (3.2%))In-hospital outcomes Unclear 94 651 (3.1) 72 501 (2.9) 18 145 (4.1) 4005 (4.2) Discharge 2 629 861 (87.4) 2 226 794 (90.3) 332 929 (74.4) 70 138 (73.2) Transfer 35 663 (1.2) 23 510 (1.0) 9025 (2.0) 3128 (3.3) DAMA/death 250 029 (8.3) 143 980 (5.8) 87 510 (19.5) 18 539 (19.4) DAMA 206 921 (6.9) 125 930 (5.1) 66 457 (14.8) 14 534 (15.2) Death 43 108 (1.4) 18 050 (0.7) 21 053 (4.7) 4005 (4.2) Length of stay Mean±SD 12.4±10.5 11.3±8.3 17.7±16.6 14.7±14.2 Median (IQR) 10.0 (7.0–14.0) 10.0 (7.0–13.0) 14.0 (8.0–22.0) 12.0 (5.0–19.0) Total fee Mean±SD 18 555.2±29 893.9 13 675.7±18 167.6 34 071.1±44 760.2 71 696.4±75 216.5 Median (IQR) 10 213.5 (6547.5–17 271.9) 9456.6 (6287.0–14 686.4) 18 114.2 (9274.5–40 106.0) 42 209.6 (11 739.6–116 403.0) Out of pocket Mean±SD 5765.0±16 395.9 4034.6±9848.3 10 980.4±25 195.7 25 951.4±48 698.2 Median (IQR) 1090.0 (0.0–5510.7) 1004.7 (0.0–4826.2) 1703.8 (0.0–11 007.8) 2624.8 (0.0–29 138.7) DAMA, discharge against medical advice.
- Table 19
In-hospital outcomes of patients with ischaemic stroke from the Hospital Quality Monitoring System in 2018 by sex
Variables Total
(n=2 466 785 (100%))Male
(n=1 460 467 (59.2%))Female
(n=1 006 318(40.8%))In-hospital outcomes Unclear 72 501 (2.9) 43 879 (3.0) 28 622 (2.8) Discharge 2 226 794 (90.3) 1 318 716 (90.3) 908 078 (90.2) Transfer 23 510 (1.0) 13 975 (1.0) 9535 (0.9) DAMA/death 143 980 (5.8) 83 897 (5.7) 60 083 (6.0) DAMA 125 930 (5.1) 73 438 (5.0) 52 492 (5.2) Death 18 050 (0.7) 10 459 (0.7) 7591 (0.8) Length of stay Mean±SD 11.3±8.3 11.5±8.5 11.0±8.0 Median (IQR) 10.0 (7.0–13.0) 10.0 (7.0–14.0) 10.0 (7.0–13.0) Total fee Mean±SD 13 675.7±18 167.6 14 349.4±19 456.1 12 698.0±16 065.1 Median (IQR) 9456.6 (6287.0–14 686.4) 9779.2 (6492.2–15 245.3) 9007.7 (6017.5–13 881.0) Out of pocket Mean±SD 4034.6±9848.3 4212.8±10 547.1 3775.9±8728.8 Median (IQR) 1004.7 (0.0–4826.2) 958.0 (0.0–4928.7) 1091.0 (0.0–4689.1) DAMA, discharge against medical advice.
- Table 20
In-hospital outcomes of patients with intracerebral haemorrhage from the Hospital Quality Monitoring System in 2018 by sex
Variables Total
(n=447 609 (100%))Male
(n=284 065 (63.5%))Female
(n=163 544 (36.5%))In-hospital outcomes Unclear 18 145 (4.1) 11 553 (4.1) 6592 (4.0) Discharge 332 929 (74.4) 210 151 (74.0) 122 778 (75.1) Transfer 9025 (2.0) 5854 (2.1) 3171 (1.9) DAMA/death 87 510 (19.5) 56 507 (19.9) 31 003 (18.9) DAMA 66 457 (14.8) 42 062 (14.8) 24 395 (14.9) Death 21 053 (4.7) 14 445 (5.1) 6608 (4.0) Length of stay Mean±SD 17.7±16.6 17.8±17.0 17.5±15.9 Median (IQR) 14.0 (8.0–22.0) 14.0 (8.0–23.0) 14.0 (8.0–22.0) Total fee Mean±SD 34 071.1±44 760.2 35 262.9±46 808.4 32 001.0±40 877.5 Median (IQR) 18 114.2 (9274.5–40 106.0) 18 317.1 (9295.0–41 467.4) 17 792.3 (9233.7–37 890.9) Out of pocket Mean±SD 10 980.4±25 195.7 11 329.7±26 102.7 10 373.6±23 525.0 Median (IQR) 1703.8 (0.0–11 007.8) 1730.3 (0.0–11 178.3) 1655.2 (0.0–10 753.5) DAMA, discharge against medical advice.
- Table 21
In-hospital outcomes of patients with subarachnoid haemorhage from the Hospital Quality Monitoring System in 2018 by sex
Variables Total
(n=95 810 (100%))Male
(n=39 815 (41.6%))Female
(n=55 995 (58.4%))In-hospital outcomes Unclear 4005 (4.2) 1679 (4.2) 2326 (4.2) Discharge 70 138 (73.2) 29 276 (73.5) 40 862 (73.0) Transfer 3128 (3.3) 1210 (3.0) 1918 (3.4) DAMA/death 18 539 (19.4) 7650 (19.2) 10 889 (19.4) DAMA 14 534 (15.2) 5897 (14.8) 8637 (15.4) Death 4005 (4.2) 1753 (4.4) 2252 (4.0) Length of stay Mean±SD 14.7±14.2 14.6±14.4 14.7±14.1 Median (IQR) 12.0 (5.0–19.0) 12.0 (5.0–19.0) 13.0 (5.0–19.0) Total fee Mean±SD 71 696.4±75 216.5 66 809.2±74 334.4 75 171.4±75 646.3 Median (IQR) 42 209.6 (11 739.6–116403.0) 33 721.9 (10 857.4–107 940.0) 50 550.0 (12 483.0–122 352.5) Out of pocket Mean±SD 25 951.4±48 698.2 24 607.7±47 861.6 26 906.9±49 262.6 Median (IQR) 2624.8 (0.0–29 138.7) 2644.0 (0.0–25 907.8) 2607.0 (0.0–32 100.0) DAMA, discharge against medical advice.
- Table 22
In-hospital outcomes of patients with ischaemic stroke from the Hospital Quality Monitoring System in 2018 by insurance
Variables Total
(n=2 466 785 (100%))URBMI
(n=932 502 (37.8%))UEBMI
(n=563 963 (22.9%))NRCMS
(n=379 973 (15.4%))Self-pay
(n=229 797 (9.3%))Other
(n=360 550 (14.6%))In-hospital outcomes Unclear 72 501 (2.9) 18 386 (2.0) 9292 (1.6) 13 094 (3.4) 5325 (2.3) 26 404 (7.3) Discharge 2 226 794 (90.3) 865 202 (92.8) 511 609 (90.7) 333 905 (87.9) 205 733 (89.5) 310 345 (86.1) Transfer 23 510 (1.0) 7553 (0.8) 6473 (1.1) 4460 (1.2) 1748 (0.8) 3276 (0.9) DAMA/death 143 980 (5.8) 41 361 (4.5) 36 589 (6.5) 28 514 (7.5) 16 991 (7.3) 20 525 (5.7) DAMA 125 930 (5.1) 32 275 (3.5) 33 708 (6.0) 27 328 (7.2) 14 815 (6.4) 17 804 (4.9) Death 18 050 (0.7) 9086 (1.0) 2881 (0.5) 1186 (0.3) 2176 (0.9) 2721 (0.8) Length of stay Mean±SD 11.3±8.3 11.8±8.6 10.8±7.5 10.6±7.0 10.7±8.9 11.7±9.4 Median (IQR) 10.0 (7.0–13.0) 10.0 (8.0–14.0) 10.0 (7.0–13.0) 10.0 (7.0–13.0) 9.0 (6.0–13.0) 10.0 (7.0–14.0) Total fee Mean±SD 13 675.7±18 167.6 14 403.4±18 780.2 13 154.4±16 494.8 12 313.2±15 499.1 14 610.3±20 919.0 13 449.4±19 595.7 Median (IQR) 9456.6 (6287.0–14 686.4) 10 029.5 (6851.6–15 320.8) 9321.1 (6206.1–14 369.0) 8662.2 (5791.2–13 360.8) 9672.4 (5997.0–15 522.3) 8863.7 (5676.5–14 327.4) Out of pocket Mean±SD 4034.6±9848.3 3424.0±9100.7 3739.3±8158.1 4250.5±9046.3 6711.1±15 278.0 4142.2±10 223.8 Median (IQR) 1004.7 (0.0–4826.2) 788.9 (0.0–3579.1) 1136.1 (0.0–4892.0) 1319.2 (0.0–5588.7) 1538.2 (0.0–8757.3) 1100.0 (0.0–5000.0) DAMA, discharge against medical advice; UEBMI, urban employee basic medical insurance; URBMI, urban resident basic medical insurance.
- Table 23
In-hospital outcomes of patients with intracerebral haemorrhage from the Hospital Quality Monitoring System in 2018 by insurance
Variables Total
(n=447 609 (100%))URBMI
(n=110 358 (24.7%))UEBMI
(n=112 805 (25.2%))NRCMS
(n=89 838 (20.1%))Self-pay
(n=72 984 (16.3%))Other
(n=61 624 (13.8%))In-hospital outcomes Unclear 18 145 (4.1) 3285 (3.0) 3039 (2.7) 4579 (5.1) 3003 (4.1) 4239 (6.9) Discharge 332 929 (74.4) 84 996 (77.0) 85 522 (75.8) 66 474 (74.0) 52 351 (71.7) 43 586 (70.7) Transfer 9025 (2.0) 2142 (1.9) 2544 (2.3) 1883 (2.1) 1225 (1.7) 1231 (2.0) DAMA/death 87 510 (19.5) 19 935 (18.1) 21 700 (19.2) 16 902 (18.8) 16 405 (22.5) 12 568 (20.4) DAMA 66 457 (14.8) 11 592 (10.5) 18 045 (16.0) 15 198 (16.9) 12 325 (16.9) 9297 (15.1) Death 21 053 (4.7) 8343 (7.6) 3655 (3.2) 1704 (1.9) 4080 (5.6) 3271 (5.3) Length of stay Mean±SD 17.7±16.6 19.8±18.4 17.5±15.7 16.9±15.2 15.4±15.6 17.9±17.4 Median (IQR) 14.0 (8.0–22.0) 15.0 (9.0–24.0) 14.0 (8.0–22.0) 14.0 (7.0–22.0) 12.0 (5.0–20.0) 14.0 (7.0–23.0) Total fee Mean±SD 34 071.1±44 760.2 39 562.8±52 449.2 31 952.4±40 252.5 30 908.3±38 416.6 32 816.8±42 964.6 34 211.1±47 366.7 Median (IQR) 18 114.2 (9274.5–40 106.0) 20 319.9 (10 849.9–45 746.2) 17 606.5 (9252.0–37 643.0) 17 159.0 (8907.0–37 146.4) 17 161.5 (7980.1–40 204.0) 17 829.6 (8647.3–39 803.6) Out of pocket Mean±SD 10 980.4±25 195.7 10 231.0±25 911.0 8594.7±19 318.0 10 993.7±23 503.0 15 571.7±31 361.6 11 232.4±26 814.8 Median (IQR) 1703.8 (0.0–11 007.8) 1789.7 (0.0–9241.1) 1133.2 (0.0–9336.3) 2176.3 (0.0–11 605.0) 2571.0 (0.0–16 693.1) 1111.6 (0.0–11 165.2) DAMA, discharge against medical advice; UEBMI, urban employee basic medical insurance; URBMI, urban resident basic medical insurance.
- Table 24
In-hospital outcomes of patients with subarachnoid haemorrhage from the Hospital Quality Monitoring System in 2018 by insurance
Variables Total
(n=95 810 (100%))URBMI
(n=21 032 (22.0%))UEBMI
(n=22 745 (23.7%))NRCMS
(n=19 550 (20.4%))Self-pay
(n=18 537 (19.3%))Other
(n=13 946 (14.6%))In-hospital outcomes Unclear 4005 (4.2) 682 (3.2) 810 (3.6) 991 (5.1) 762 (4.1) 760 (5.4) Discharge 70 138 (73.2) 15 793 (75.1) 16 554 (72.8) 14 056 (71.9) 13 541 (73.0) 10 194 (73.1) Transfer 3128 (3.3) 604 (2.9) 790 (3.5) 709 (3.6) 532 (2.9) 493 (3.5) DAMA/death 18 539 (19.4) 3953 (18.8) 4591 (20.1) 3794 (19.4) 3702 (20.0) 2499 (17.9) DAMA 14 534 (15.2) 2383 (11.3) 3898 (17.1) 3417 (17.5) 2965 (16.0) 1871 (13.4) Death 4005 (4.2) 1570 (7.5) 693 (3.0) 377 (1.9) 737 (4.0) 628 (4.5) Length of stay Mean±SD 14.7±14.2 16.3±15.9 15.2±14.0 14.0±13.1 12.7±13.0 14.7±14.6 Median (IQR) 12.0 (5.0–19.0) 13.0 (7.0–21.0) 13.0 (5.0–20.0) 12.0 (5.0–19.0) 10.0 (3.0–17.0) 12.0 (5.0–19.0) Total fee Mean±SD 71 696.4±75 216.5 81 013.7±83 464.7 71 201.1±72 076.7 69 499.2±71 081.8 63 627.2±69 663.0 72 258.4±78 307.1 Median (IQR) 42 209.6 (11 739.6–116403.0) 50 979.9 (14 659.4–129647.8) 44 732.7 (12 527.5–115641.5) 41 154.8 (11 503.8–114094.1) 31 431.9 (8915.4–107171.6) 43 232.1 (11 105.2–113725.8) Out of pocket Mean±SD 25 951.4±48 698.2 24 882.1±48 723.0 21 512.9±39 577.7 27 276.7±49 768.8 31 104.1±55 461.3 26 096.3±50 258.8 Median (IQR) 2624.8 (0.0–29 138.7) 2784.0 (0.0–28 030.3) 2384.1 (0.0–25 701.2) 2635.7 (0.0–30 257.5) 3432.3 (0.0–34 795.2) 1921.3 (0.0–31 379.9) DAMA, discharge against medical advice; NRCMS, new rural cooperative medical schema; UEBMI, urban employee basic medical insurance; URBMI, urban resident basic medical insurance.
- Table 25
In-hospital outcomes of patients with ischaemic stroke from the Hospital Quality Monitoring System in 2018 by admission day
Variables Total
(n=2 466 785 (100%))Weekdays
(n=1 928 908 (78.2%))Weekend
(n=537 877 (21.8%))In-hospital outcomes Unclear 72 501 (2.9) 56 460 (2.9) 16 041 (3.0) Discharge 2 226 794 (90.3) 1 746 541 (90.5) 480 253 (89.3) Transfer 23 510 (1.0) 17 942 (0.9) 5568 (1.0) DAMA/death 143 980 (5.8) 107 965 (5.6) 36 015 (6.7) DAMA 125 930 (5.1) 94 566 (4.9) 31 364 (5.8) Death 18 050 (0.7) 13 399 (0.7) 4651 (0.9) Length of stay Mean±SD 11.3±8.3 11.3±8.3 11.2±8.2 Median (IQR) 10.0 (7.0–13.0) 10.0 (7.0–14.0) 10.0 (7.0–13.0) Total fee Mean±SD 13 675.7±18 167.6 13 586.5±18 036.6 13 995.8±18 626.0 Median (IQR) 94 56.6 (6287.0–14 686.4) 9407.3 (6267.8–14 592.3) 9637.7 (6361.6–15 030.5) Out of pocket Mean±SD 4034.6±9848.3 4001.6±9767.2 4153.0±10 133.1 Median (IQR) 1004.7 (0.0–4826.2) 993.5 (0.0–4776.9) 1090.7 (0.0–4993.8) DAMA, discharge against medical advice.
- Table 26
In-hospital outcomes of patients with intracerebral haemorrhage from the Hospital Quality Monitoring System in 2018 by admission day
Variables Total
(n=447 609 (100%))Weekdays
(n=330 517 (73.8%))Weekend
(n=117 092 (26.2%))In-hospital outcomes Unclear 18 145 (4.1) 13 302 (4.0) 4843 (4.1) Discharge 332 929 (74.4) 247 509 (74.9) 85 420 (73.0) Transfer 9025 (2.0) 6608 (2.0) 2417 (2.1) DAMA/death 87 510 (19.5) 63 098 (19.1) 24 412 (20.8) DAMA 66 457 (14.8) 47 945 (14.5) 18 512 (15.8) Death 21 053 (4.7) 15 153 (4.6) 5900 (5.0) Length of stay Mean±SD 17.7±16.6 17.7±16.6 17.5±16.5 Median (IQR) 14.0 (8.0–22.0) 14.0 (8.0–22.0) 14.0 (7.0–23.0) Total fee Mean±SD 34 071.1±44 760.2 33 861.7±44 754.3 34 662.1±44 771.8 Median (IQR) 18 114.2 (9274.5–40 106.0) 17 974.0 (9246.1–39 679.7) 18 550.7 (9355.4–41 345.0) Out of pocket Mean±SD 10 980.4±25 195.7 10 885.0±25 056.2 11 249.6±25 583.4 Median (IQR) 1703.8 (0.0–11 007.8) 1673.0 (0.0–10 916.6) 1790.2 (0.0–11 272.2) DAMA, discharge against medical advice.
- Table 27
In-hospital outcomes of patients with subarachnoid haemorrhagefrom the Hospital Quality Monitoring System in 2018 by admission day
Variables Total
(n=95 810 (100%))Weekdays
(n=70 247 (73.3%))Weekend
(n=25 563 (26.7%))In-hospital outcomes Unclear 4005 (4.2) 2949 (4.2) 1056 (4.1) Discharge 70 138 (73.2) 51 686 (73.6) 18 452 (72.2) Transfer 3128 (3.3) 2303 (3.3) 825 (3.2) DAMA/death 18 539 (19.4) 13 309 (18.9) 5230 (20.4) DAMA 14 534 (15.2) 10 413 (14.8) 4121 (16.1) Death 4005 (4.2) 2896 (4.1) 1109 (4.3) Length of stay Mean±SD 14.7±14.2 14.7±14.2 14.6±14.3 Median (IQR) 12.0 (5.0–19.0) 13.0 (5.0–19.0) 12.0 (5.0–19.0) Total fee Mean±SD 71 696.4±75 216.5 71 390.9±74 985.1 72 536.0±75 843.9 Median (IQR) 42 209.6 (11 739.6–116 403.0) 41 698.9 (11 721.4–11 5905.7) 43 489.2 (11 801.6–11 7909.9) Out of pocket Mean±SD 25 951.4±48 698.2 25 661.8±48 358.4 26 747.2±49 612.4 Median (IQR) 2624.8 (0.0–29 138.7) 2565.4 (0.0–28 462.2) 2795.4 (0.0–31 122.6) DAMA, discharge against medical advice.


